
~50mcane growers and family members affectedGovernment statement; not a census
INDIA SUGAR BRIEF · UPDATED 10 AUGUST 2026
India’s
sugar industry
India’s sugar market is shaped not only by cane output, but by farmer payments, ethanol diversion, domestic availability and managed export access.
Use this brief as a decision map: follow cane into mills, then through sugar, ethanol and by-products; read prices and stocks alongside policy; and treat export potential as a managed outcome rather than a residual surplus.
01
Why India matters to the global sugar market
India is one of the world’s largest sugar consumers. A change in cane availability, ethanol economics or policy can first alter domestic balances and then reshape trade availability.
Production alone is not the answer. The Fair and Remunerative Price (FRP) sets a central benchmark for cane procurement at a base recovery rate. Recovery adjustments, mill cash flow, monthly release arrangements, inventory and domestic prices all matter before export access can be considered.
02
Growing regions, growers and mills: the industry’s physical base
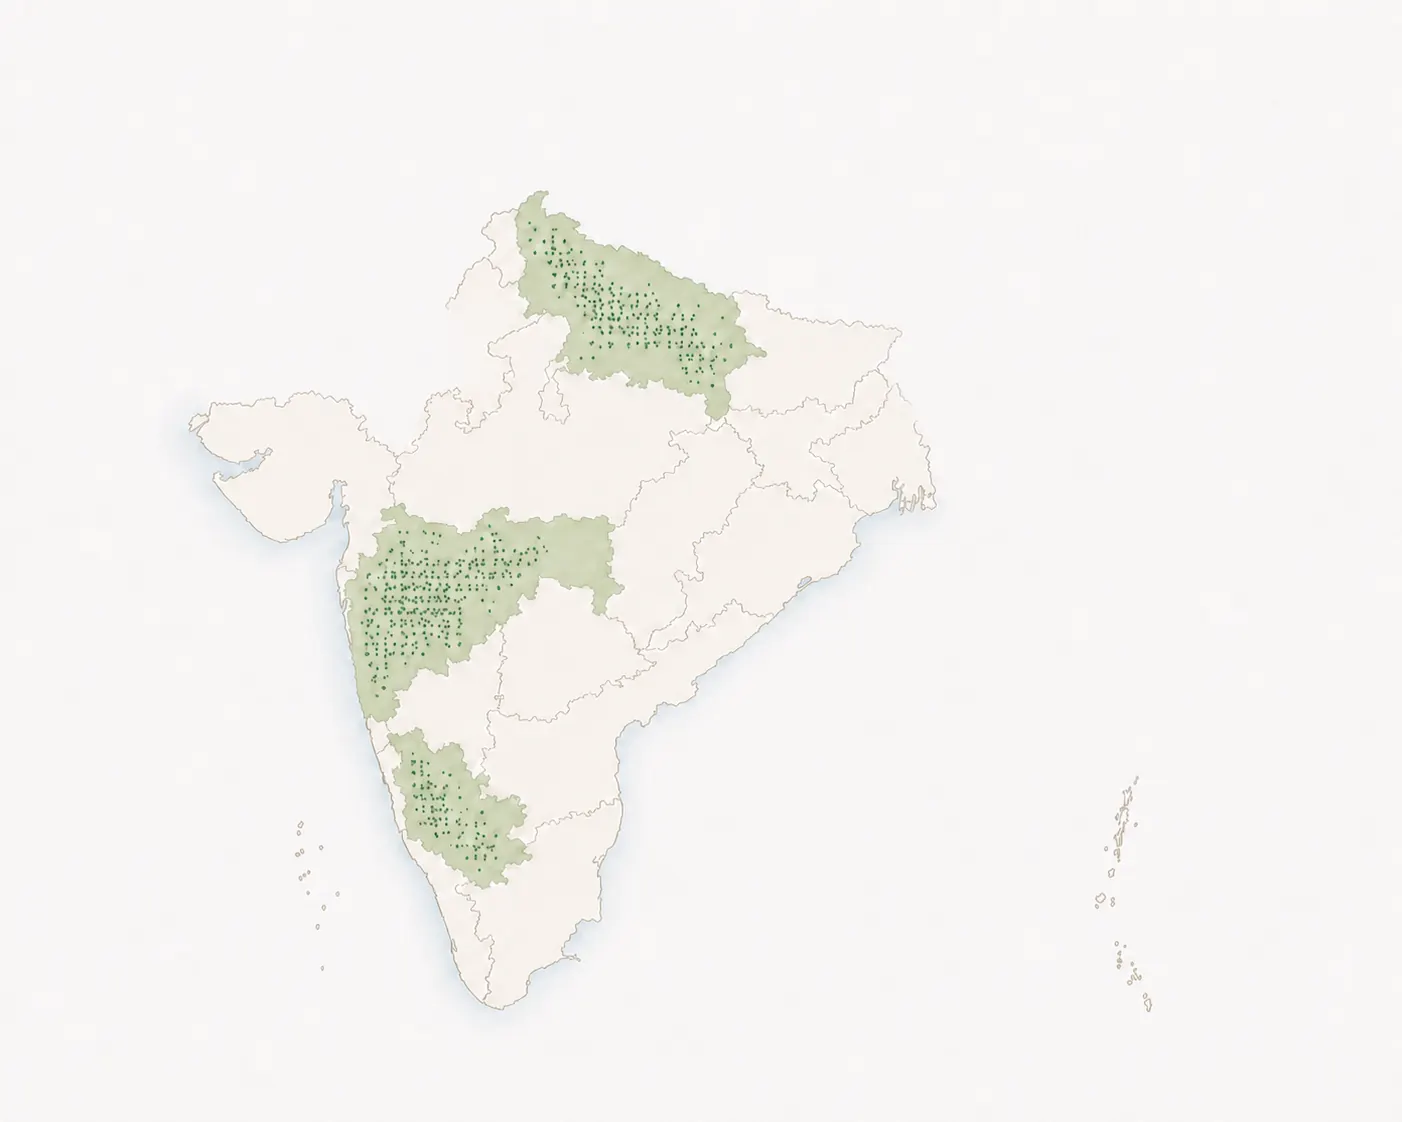
Uttar Pradesh, Maharashtra and Karnataka are the first regions to watch. Their different rainfall, recovery and logistics profiles shape crushing pace and mill economics.
Uttar Pradesh is a major cane region with comparatively strong irrigation; crushing commonly runs from November into June.
Maharashtra combines cooperative and large corporate mills, with dense processing capacity and mature by-product systems.
Karnataka is a major producing state where seasonal weather and cane availability affect the length of the crushing season.
541mills operating in the periodas at 31 Mar 2026; not a registered total
Major-state sugar output in 2025/26 (to 15 Mar 2026)million tonnes
| State | Sugar output | Share of period output | Recovery |
|---|
03
From cane field to world market: one system, several outlets
The same cane supply underpins sugar, ethanol, power and grower payments. Policy changes the allocation among them.
Cane growing
Weather, irrigation, variety and the cane price determine mill supply and crushing pace.
Organisation & crushing
Cooperatives and private mills procure cane, crush it and settle grower payments.
Sugar, ethanol & co-products
Juice, syrup and molasses may be diverted to ethanol; bagasse supports heat and power.
Domestic market & exports
Domestic availability is the base case; stocks, prices and permissions determine trade access.
Sources: USDA FAS, PIB, DFPD, ISMA, NFCSF, AISTA and ynsugar datasets
04
Policy mechanics: government sets the tempo
Cane pricing, ethanol, inventory and export arrangements jointly influence mill cash flow and marketable supply.
05
Trade balance: exports are paced, not automatic
Read production, domestic use, stocks and export permissions together.
India sugar supply and use balance, 2021/22–2026/27million tonnes
| Season | Production | Use | Imports | Exports | Ending stocks |
|---|
When domestic supply and price stability are the policy objective, export allocation functions as an adjustable gate rather than an automatic surplus.
06
India spot sugar price, 2009–2026
Domestic prices reflect supply, demand and policy. Inventory and policy signals can reach the physical market before annual production is clear.
Indian rupees / 100 kg
Source: ynsugar dataset, compiled from Investing public historical dataDaily closing observations; some dates may be missing.
06A
FRP · DOMESTIC PRICE · EXPORT POLICY
Three gates in one system: FRP, price and exports
FRP enters cane cost and grower payables first; domestic prices, monthly releases and stocks influence the pace of cash recovery; exports are allocated when domestic availability and price stability allow.
01 · COST BASE
₹365 / quintalFRP establishes the cane-cost floor
For 2026/27, the FRP is ₹365 per quintal at a 10.25% base recovery rate. Recovery-linked adjustments feed directly into cane payables and mill raw-material costs.
Cost transmits to the selling side02 · CASH RECOVERY
4,716 INR / 100 kgDomestic prices influence payment capacity
Domestic prices, monthly releases and inventory holdings shape selling pace and cash conversion. Production alone does not determine whether mills can settle cane dues on time.
Stocks and cash flow frame policy room03 · POLICY GATE
Quota-ledExports are an adjustable policy gate
Government monitors production, sales, stocks and prices. Export quantities may be released, reallocated or tightened only when domestic supply and price objectives permit.
Supply changes feed back to the home marketCore relationship: FRP constrains the mill’s cane-cost base; domestic prices and release pacing influence cash conversion; export allocation adjusts marketable inventory. This is an institutional and cash-flow relationship, not a one-variable causal model.
Sources: India’s DFPD and PIB; ynsugar India spot-price dataset
07
Key institutions in India’s sugar sector
Government departments design and administer the framework. ISMA, NFCSF and AISTA offer complementary industry perspectives; their statistics should not be treated as interchangeable with official series.
08
READER QUESTIONS · EVIDENCE-LED ANSWERS
India sugar industry: frequently asked questions
Short answers for readers who need to distinguish the physical sugar balance from the policy and cash-flow mechanisms around it.
What is India’s sugar season?
India’s sugar season generally runs from October to September. In this brief, season labels follow that convention; ethanol references may instead use the separate ethanol supply year (ESY). Always check the stated period before comparing series.
What is FRP, and how does it differ from a State Advised Price (SAP)?
The Fair and Remunerative Price (FRP) is the central government’s minimum cane price payable by mills. It is set before the season and linked to a base sugar-recovery rate. Some states set a SAP, which can be higher than FRP; the DFPD identifies Uttar Pradesh, Punjab, Haryana and Uttarakhand as SAP states. Read the DFPD policy note
What is the FRP for the 2026/27 sugar season?
India’s Cabinet Committee on Economic Affairs approved an FRP of ₹365 per quintal for 2026/27 at a 10.25% base recovery rate. The official release also specifies a recovery-linked premium or reduction of ₹3.56 per quintal for each 0.1 percentage-point change around that base. Read the PIB release
Why does a larger sugar crop not automatically mean more exports?
Exports are subject to policy decisions and may be allocated by quota. Under the Sugar (Control) Order, 2025, the government can regulate production, sales and international trade, including releases for sale and export/import. Domestic availability, stocks and price conditions therefore matter alongside production. DFPD policy framework
How does ethanol affect India’s sugar balance?
Cane juice, syrup and molasses can be directed to ethanol instead of sugar. This changes the volume of cane available for crystallised sugar and brings energy-policy incentives into the sugar balance. The effect should be assessed by season and feedstock, not assumed from the ethanol blend rate alone.
Why are domestic price and monthly release arrangements relevant to cane payments?
FRP sets the cane-cost floor, but a mill’s capacity to pay also depends on the pace at which it can sell sugar and convert inventory into cash. The DFPD states that the minimum selling price was introduced to help the industry cover the minimum cost of production and clear cane-price dues. DFPD pricing policy
What does “raw-value basis” mean in the supply and use table?
It means the production, use, trade and stock figures are presented on the basis used in USDA FAS’s India Sugar Annual, rather than being mixed with another sugar-equivalent convention. Comparable tables require the same basis; a number should not be combined with crystal-value or net-sugar series without an explicit conversion.
Are the Maharashtra, Uttar Pradesh and Karnataka figures a final production ranking?
No. The state figures are period-to-date observations compiled from NFCSF data through 15 March 2026. They indicate the crushing-season position at that time and should not be treated as final full-season rankings.
09
Sources, method and limits
This brief is prepared by ynsugar Research from public primary and industry sources. Cane area and output follow USDA FAS Table 1; sugar production, use, trade and stocks follow Table 2 on a raw-value basis. Period data, estimates and forecasts are labelled separately.
Research disclosurePublished 10 August 2026 · Evidence links last checked on that date · This page is free to access and is not investment advice.
Primary and sector sources
USDA FAS, India’s PIB and DFPD, NFCSF, ISMA, AISTA, and ynsugar data compilation.
Open source list
Interpretation limits
India’s sugar season generally runs from October to September. USDA historical estimates can be revised between reports. The state figures on this page are period-to-date, not a final season ranking; the AISTA overview does not state a common reference period for all figures.