China imported 4.92 million MT of sugar in 2025 — remaining elevated despite recovering domestic production and weaker global sugar prices. Brazil dominates supply, while provincial and trade-type structures show significant new shifts.
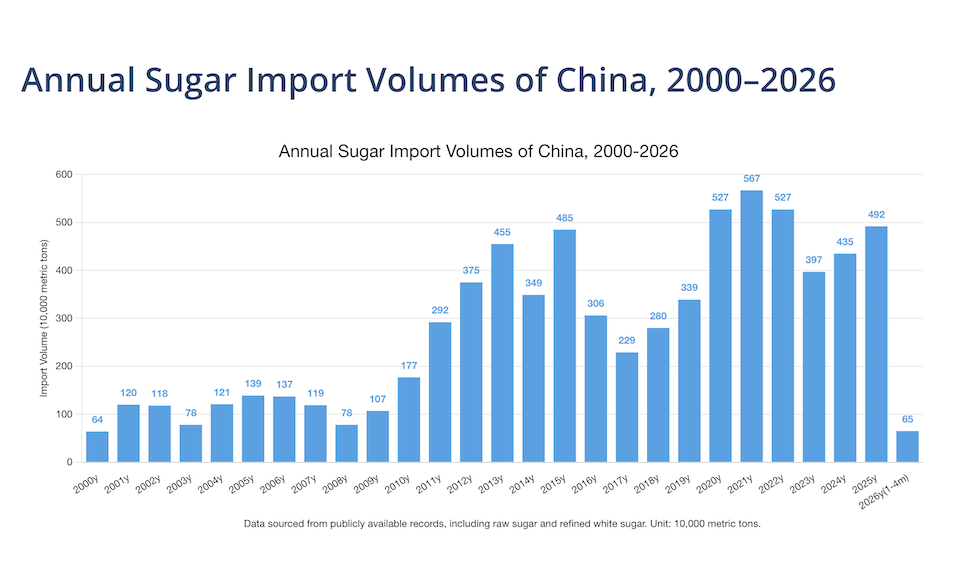
A long-term perspective on China's sugar import volumes to gauge where 2025 stands relative to historical peaks.
Source: General Administration of Customs (unit: 10,000 MT, rounded). Click here for interactive chart →
Volume, product mix, prices, origins, and trade structure — the full picture in eight data points.
China imported 4.9179 million MT of sugar in 2025, up 561,400 MT year-on-year and roughly 80,000 MT above the five-year average — placing it in the "above-average" range.
Raw sugar imports reached 4.5715 million MT (92.96% share). Refined white sugar was just 344,100 MT — the lowest in a decade — as imports were primarily sourced for refinery processing.
The full-year average CIF price was ~CNY 3,162/MT, down ~CNY 752/MT year-on-year — the lowest since 2022 — significantly reducing downstream procurement costs.
China imported 4.2916 million MT from Brazil, representing 87.26% of total sugar imports. Dependence on a single supplier increased further year-on-year.
Guangdong and Shandong led all provinces at ~989,400 MT and ~988,800 MT respectively. Beijing, Guangxi, and Liaoning rounded out the top five.
General trade accounted for 2.8602 million MT (58.16%); goods moving through bonded warehouses added 1.4322 million MT (29.12%) — together nearly 90% of total imports.
China exported approximately 144,100 MT of sugar in 2025, primarily to North Korea and Hong Kong SAR. The volume is small enough to have negligible impact on domestic supply-demand.
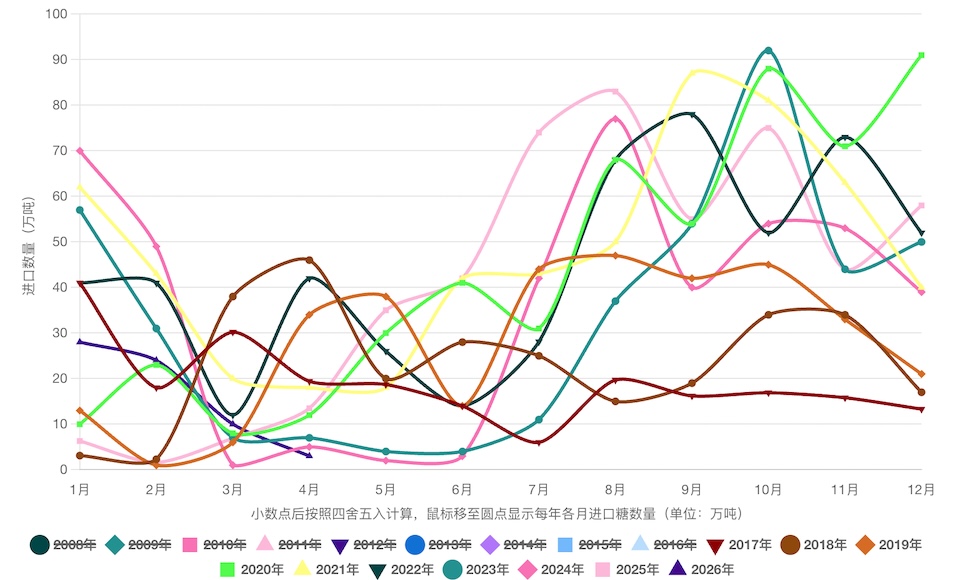
Cumulative imports in October–December 2025 totalled 1.7626 million MT — up 300,900 MT year-on-year — suggesting faster-than-usual pre-season inventory replenishment.
Monthly data reveals concentrated arrival windows and shifts in product composition throughout the year.
Source: General Administration of Customs
December arrivals were dominated by raw sugar, serving refinery pre-crush-season stocking needs.
Early 2025/26 crush-season arrivals clearly outpaced the prior season, adding competitive pressure on domestically produced sugar.
A pullback in global sugar prices combined with exchange-rate movements drove a pronounced decline in China's 2025 import costs.
The 2025 CIF price dropped markedly from 2024 levels, delivering a clear cost advantage for importers.
The overall picture remains "Brazil-led, supplemented by Thailand and Central America," though non-Brazilian sources are gaining a slightly larger foothold.
| Rank | Origin Country | Volume (10,000 MT) | Share | YoY Change |
|---|---|---|---|---|
| 1 | Brazil | 429.16 | 87.26% | +45.92 (×10,000 MT) |
| 2 | Thailand | 17.17 | 3.49% | Notably higher |
| 3 | South Korea | 11.84 | 2.41% | — |
| 4 | Nicaragua | 9.57 | 1.95% | Notably higher |
| 5 | El Salvador | 9.00 | 1.83% | Notably higher |
Raw sugar is highly concentrated in Brazil; Central American nations are gradually increasing their share.
White sugar origins are more diversified, primarily serving structural supplementation and specific quality requirements.
Coastal trading hubs and major sugar-producing provinces together define the geographic footprint of China's sugar imports.
| Rank | Province / Region | Volume (10,000 MT) | Share | Product Type |
|---|---|---|---|---|
| 1 | Guangdong | 98.94 | 20.12% | Raw 90.56 + White 8.15 |
| 2 | Shandong | 98.88 | 20.10% | Raw 93.11 + White 5.77 |
| 3 | Beijing | 86.88 | 17.66% | Raw 79.34 + White 7.52 |
| 4 | Guangxi | 59.07 | 12.01% | Raw 59.07 (decade-high) |
| 5 | Liaoning | 47.76 | 9.71% | Raw 41.47 + White 6.29 |
| 6 | Jiangsu | 36.19 | 7.36% | Predominantly raw |
| 7 | Hebei | 27.31 | 5.55% | Predominantly raw |
Guangxi's raw sugar imports hit a decade-high, reflecting an increase in direct imports by producing-region refineries.
White sugar is used primarily for structural supplementation; its provincial distribution closely tracks consumption and re-export demand.
Different trade channels carry distinct tariff treatments, policy implications, and end-market uses.
General trade and bonded channels combined account for nearly 90% of total imports — the core indicators for reading import pace.
Bonded-warehouse raw sugar imports surged ~515,000 MT YoY, reflecting active warehouse-trade and re-export activity.
Exported products are primarily branded finished sugar or value-added processed goods, priced well above CIF import costs.
| Rank | Export Destination | Volume (10,000 MT) | Share |
|---|---|---|---|
| 1 | North Korea | 5.93 | 41.14% |
| 2 | Hong Kong SAR | 3.17 | 21.98% |
| 3 | Other countries & regions | ~5.31 | ~36.88% |
Viewing China's demand through Brazil's export lens helps explain import cost dynamics and supply-security considerations.
China is firmly established as Brazil's single largest sugar buyer and wields considerable influence over Brazilian exports and global pricing.
Structured answers to the questions most important to industry participants, based on data presented in this report.