Executive Summary: March 2026 concluded with a volatile but bullish tone for sugar markets. While ICE No. 11 prices rallied nearly 12% on the back of energy-driven momentum and FX support, the late-month selloff underscores a growing conflict between geopolitical risk premiums and robust global supply fundamentals.
Technical Overview — ICE No. 11 Raw Sugar (May/26)
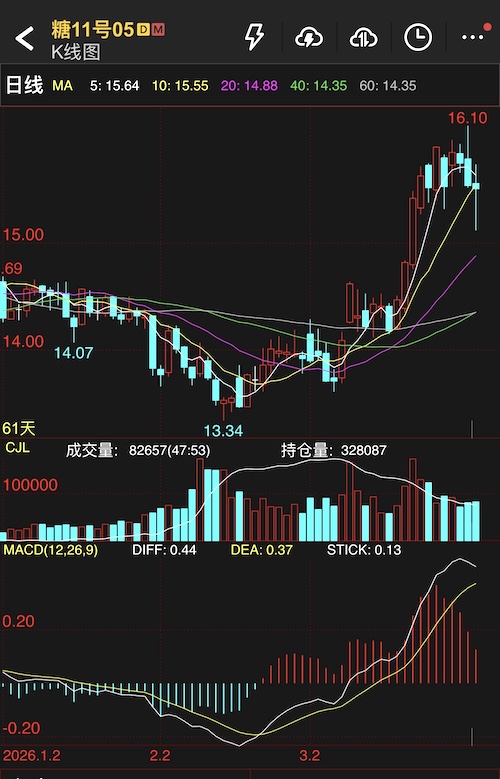
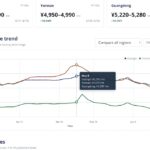
The price action for the May/26 contract throughout Q1 2026 tells a story of energy buildup and breakout:
-
Basing Phase (Jan–Mid Feb): Prices coiled in a tight range between 13.34 and 14.07 c/lb, with major moving averages (MA5/10/20/40/60) converging.
-
The March Breakout: A decisive rally pushed prices to a high of 16.10 c/lb—a gain of over 20% from the January lows.
-
Current Indicators: While the primary trend remains bullish (MA5 > MA10 > MA20), the MACD histogram (0.13) is narrowing, and volume is tapering. This suggests fading upside conviction as prices approach the psychological 16.00 resistance level.
Strategic Outlook: The “Bull vs. Bear” Tug-of-War
As we enter April, the market is navigating a complex interplay of macroeconomic drivers and physical fundamentals. YnSugar Analysis breaks down the two opposing narratives:
📈 The Bull Case (Supportive Factors)
-
Geopolitical Escalation: If Middle East tensions persist Energy prices remain elevated Ethanol economics strengthen The sugar-ethanol parity tilts toward ethanol in Brazil Sugar production is reduced as mills prioritize fuel over sweetener.
-
Currency Support: A strengthening Brazilian Real (BRL) against the USD discourages Brazilian mills from aggressive export selling, effectively tightening global spot availability.
📉 The Bear Case (Pressure Points)
-
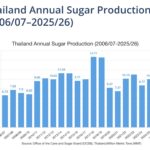
Robust Supply Outlook: Despite the rally, Brazil’s upward production trajectory remains intact. Combined with strong output from India, the global supply-demand balance remains relatively loose, capping long-term upside.
-
Volatility of Risk Premiums: Geopolitical gains are notoriously unstable. Any diplomatic breakthrough, de-escalation, or ceasefire announcement would likely trigger a rapid liquidation of long positions and a swift retracement of March gains.
March 2026 Performance Recap
ICE New York — No. 11 Raw Sugar (US cents/lb) | Contract | Mar 2 (Open) | Mar 31 (Close) | Monthly Change | | :— | :— | :— | :— | | May/26 | 13.91 | 15.52 | +11.57% | | Jul/26 | 13.90 | 15.68 | +12.81% | | Oct/26 | 14.23 | 16.05 | +12.79% |
ICE London — No. 5 White Sugar (USD/ton) | Contract | Mar 2 (Open) | Mar 31 (Close) | Monthly Change | | :— | :— | :— | :— | | May/26 | 413.60 | 448.50 | +8.44% | | Aug/26 | 410.00 | 452.00 | +10.24% | | Oct/26 | 408.80 | 455.40 | +11.40% |
Bottom Line
The sugar market is currently “headline-driven.” While technicals favor the bulls, the underlying fundamental undertow remains bearish. Market participants should monitor Middle East developments and UNICA crushing data closely. Caution is advised when chasing the rally near 16.00 c/lb without a significant new catalyst.
Data Sourced from ICE, UNICA, and NFCSF. For informational purposes only.