Sugar is more than a kitchen staple. It is a globally traded commodity whose price movements ripple through an entire supply chain—from the fields where sugarcane and sugar beets grow, all the way to the products on our tables. In China, one of the world’s largest producers and consumers of sugar, having a scientific, objective, and timely price reference system carries real practical weight for everyone involved in the industry.
About two decades ago, in 2007, Yuntang Network launched the CSI National Sugar Spot Price Index. It quickly earned a strong reputation, attracting recommendations from leading domestic media outlets and adoption by multiple publicly listed companies. For various reasons, the system was eventually discontinued. This year, after considerable effort from multiple parties, the project has been brought back to life.
The new system retains a clean, user-friendly interface and offers seamless support across desktop, mobile, and tablet devices. Most importantly, it remains completely free for all visitors.
Price Discovery: From Guesswork to Precision
In an industry without a systematic price index, market participants often piece together their understanding of “current conditions” from fragments—a local transaction price here, a quote shared in a group chat there, a phone call to check the going rate. This information is scattered and unstructured, making it difficult to form an accurate read on the broader market.
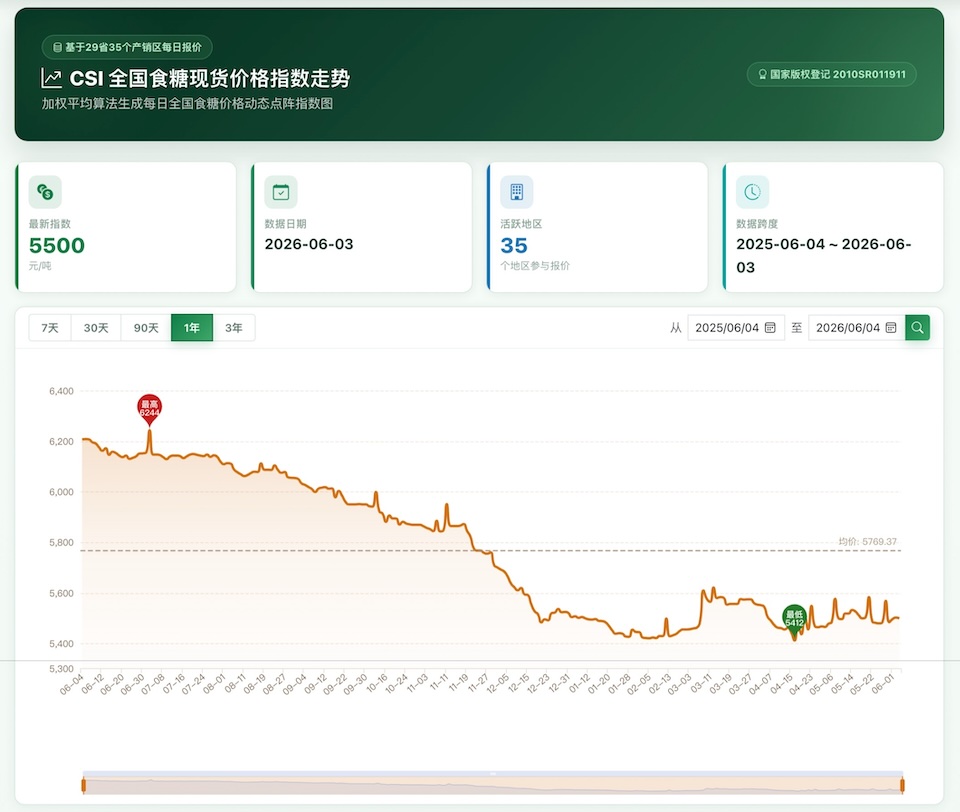
The core value of the CSI China Sugar Spot Price Index lies in solving exactly this problem. It gathers daily transaction data from 35 major production and sales regions across the country—areas that together account for roughly 90% of China’s total sugar production and consumption—and consolidates that information into a single, quantifiable price benchmark through a unified methodology and calculation model.
This benchmark moves the market from “a vague feeling” toward “precise understanding.”
The 35 regions are not fixed in stone. They are adjusted dynamically as the industry evolves. For example, with imported refined sugar accounting for an increasingly large share of the market in recent years, the index will incorporate prices from areas where major refineries are concentrated, while phasing out regions whose weighting has shrunk. This ongoing recalibration keeps the CSI both scientifically sound and practically useful.
Who Benefits, and How
Sugar producers can compare the national index against regional prices to assess whether their own factory pricing is reasonable, gauge the overall national supply-and-demand picture, and develop more informed pricing strategies and sales timing.
Traders can quickly identify price differences between regions, spot arbitrage opportunities, and track price trends to time their purchases and sales. The index also gives them an objective reference point during negotiations with both suppliers and customers.
End users in the food and beverage, pharmaceutical, and baking industries—for whom sugar is a significant input cost—can plan procurement budgets more rationally. When signing long-term supply contracts, the index can serve as a benchmark for price adjustments, helping these businesses monitor raw material cost fluctuations and adjust production and inventory strategies in a timely manner.
Analysts and research institutions stand to gain perhaps the most. The CSI system has accumulated more than 20 years of continuous daily price data. This dataset is a valuable industry asset in its own right—useful for studying the seasonality of sugar price movements, analyzing how policy shifts, weather events, and international markets transmit into domestic prices, and building forecasting models that provide a quantitative foundation for business decisions.
A System That Keeps Improving
A price index is never truly “finished”—it is a work in continuous refinement. As the data collection network expands, the calculation model is optimized, and user feedback accumulates, the CSI National Sugar Spot Price Index will keep delivering more accurate and more valuable reference services to the sugar market.
We firmly believe that a transparent, objective, and traceable market price system is essential infrastructure for the healthy development of the entire industry.
We invite you to visit and use the CSI National Sugar Spot Price Index—and we welcome your feedback.
Related Market Intelligence:
Gain deeper insights into China’s trade dynamics by reading our comprehensive China Sugar Import Report, which details the key factors shaping today’s price references.
About the China Sugar Index (CSI)
The China Sugar Index (CSI) Spot Price Index uses Grade 1 white granulated sugar (per China’s national standard GB/T 317-2018) as its benchmark product. It collects daily spot prices from 35 major sugar production and sales regions across 29 provinces and municipalities—areas that together represent more than 90% of China’s total sugar production and consumption. After weighted averaging, the system generates a daily national sugar price dot-matrix index chart.
The daily weighting coefficient for each region is allocated scientifically and reasonably based on local production volume, sales volume, market reach, and other relevant factors. The system holds an official national copyright registration (No. 2010SR011911).
Disclaimer: The China Sugar Index (CSI) provided herein is for informational and reference purposes only. While we strive to ensure the accuracy and reliability of the data, ynsugar.com makes no warranties, express or implied, regarding its completeness or timeliness. Market participants should not rely solely on this index for trading or investment decisions. ynsugar.com shall not be held liable for any financial losses arising from the use of this data.