For buyers, producers, traders and analysts following China’s sugar market, the challenge is rarely finding one price. The harder task is placing that price in context: how it compares with other producing regions, how the market has moved over time and what the quotation means in a common reference currency.
YnSugar has launched the China Sugar Price Hub to bring those elements together on one continuously updated page.
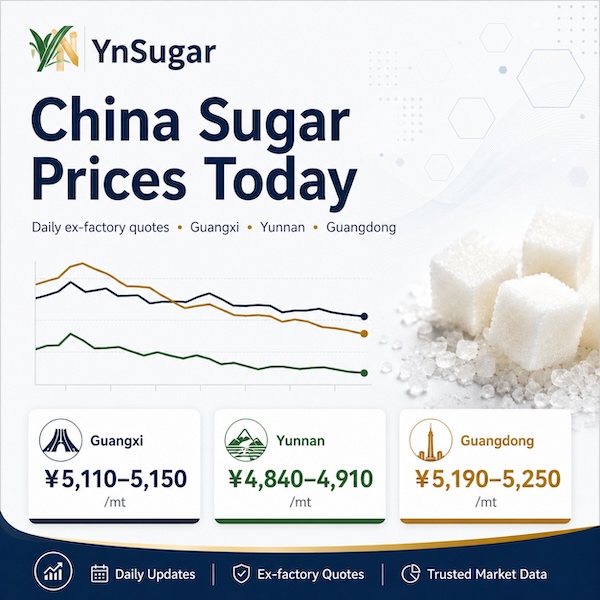
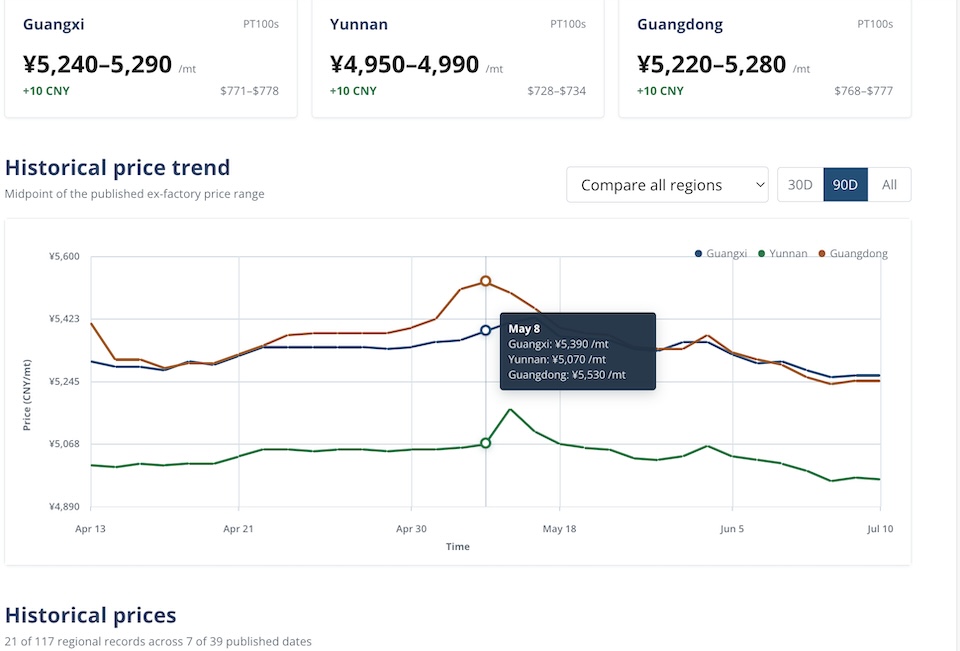
The hub tracks daily ex-factory quotations for standard Grade 1 white granulated sugar, identified as PT100s, across Guangxi, Yunnan and Guangdong. Prices are published in Chinese yuan per metric ton, include VAT and are accompanied by indicative US dollar equivalents.
What the Price Hub provides
The latest regional quotations appear at the top of the page, making it easy to compare the current price range and reported daily change in each market.
The interactive historical chart then places those figures in context. Readers can compare all three regions on the same chart or focus on one region, switch between 30-day, 90-day and full-history views, and move the pointer across the chart to see the price recorded on a particular date.
Below the chart, a structured historical table provides the underlying published records. It includes:
- Publication date
- Region and grade
- CNY price range per metric ton
- Midpoint of the published range
- Daily change and percentage change
- Indicative USD range per metric ton
The table initially presents the latest week of data. Additional weeks can be revealed without leaving the page, helping readers move from a current-market snapshot to a longer historical review.
Why regional comparison matters
China’s domestic sugar market is not a single uniform price point. Guangxi is the country’s leading sugar-producing region, while Yunnan is another major cane-growing area with its own production cycle, logistics and local market conditions. Guangdong adds an important consuming and trading-market perspective.
Comparing these quotations can help readers observe regional price spreads and identify whether a movement is broad-based or concentrated in one market. These differences may reflect supply availability, transport costs, seasonal production patterns, purchasing activity and other local conditions.
The Price Hub does not attempt to reduce those dynamics to a single national benchmark. Instead, it preserves the published regional ranges so users can examine the market with appropriate context.
Transparent methodology and currency conversion
Price data is compiled from regional market surveys and presented as published ex-factory ranges. YnSugar keeps the original publication dates in the historical record so readers can distinguish the latest quotation from earlier observations.
US dollar values are reference conversions rather than separately surveyed dollar-denominated prices. They are calculated using the latest available CNY/USD reference rate derived from European Central Bank data via Frankfurter. The exchange-rate date is displayed on the page because foreign-exchange markets, weekends and public holidays do not always align with China sugar-price publication dates.
The methodology, dataset coverage, latest update time and publisher information are displayed directly on the hub. A public JSON data endpoint is also available for readers and developers who need a structured, machine-readable version of the dataset.
Built as a lasting market resource
The China Sugar Price Hub replaces a fragmented reading experience with a permanent reference page. New working-day observations are added to the same dataset, while earlier records remain available for comparison.
This structure is useful for several types of reader:
- Sugar buyers and procurement teams can review current regional price ranges before supplier discussions.
- Producers and traders can compare regional movements and monitor short-term price direction.
- Analysts and researchers can use the historical table to examine changes over time.
- International readers can view indicative USD equivalents while retaining the original CNY quotations.
The hub also connects price data with YnSugar’s broader reporting on Chinese production, imports, policy and global sugar-market developments. This helps readers move from the daily number to the supply, demand and trade factors that may be shaping it.
Access the latest China sugar prices
Visit the YnSugar China Sugar Price Hub to view the latest quotations, compare Guangxi, Yunnan and Guangdong, and explore the available historical record.
For broader market context, readers can also explore the China Sugar Import Report and Global Sugar Insights.
Editorial and methodology note: The Price Hub is maintained by the YnSugar Analysis Team. YnSugar has more than 20 years of industry focus and publishes research on sugar pricing, production, trade and policy. Price observations and currency conversions are provided for informational and research purposes only. They do not constitute financial, trading, procurement or investment advice. Readers should verify material commercial decisions with their own market sources. Questions or correction requests may be submitted through the YnSugar contact page.