Market Analysis by the ynsugar Research Team | June 27, 2026
Market Overview
Global sugar futures rallied strongly on Friday, June 26, with gains across both New York and London markets signaling a notable shift in short-term sentiment.
ICE New York’s front-month July raw sugar contract closed up 0.43 cents/lb (+3.17%), while the more actively traded October contract — the current benchmark — settled at 14.51 cents/lb (+2.91%). London’s August white sugar futures outperformed, surging $19.30/MT (+4.34%) to close at $464/MT, a level not seen in approximately three months. Raw sugar futures also hit their highest point in nearly two weeks, with bullish positioning becoming increasingly evident across the market.
Technical Analysis
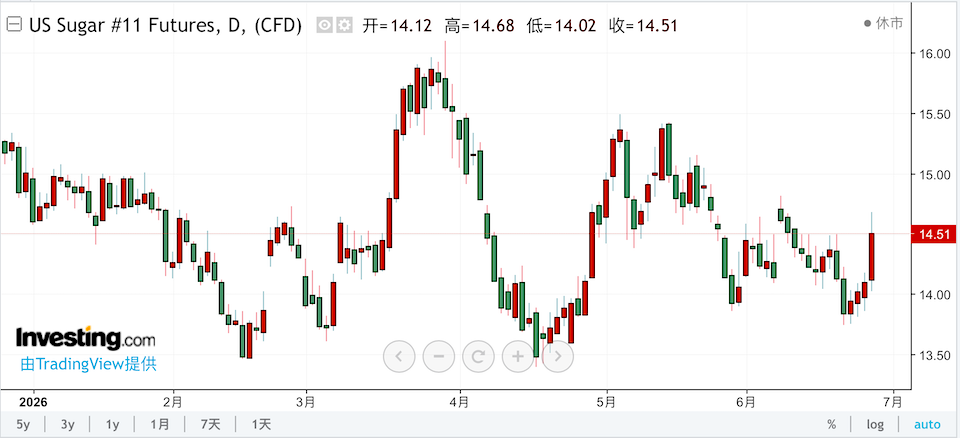
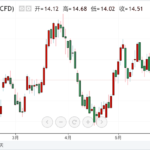
The October raw sugar contract has been trading within a 13.74–14.68 cents/lb range following a broader pullback from the prior high of 15.97 cents. Friday’s session printed a low of 14.02 and a high of 14.68, closing at 14.51 — a recovery from recent support near 13.74.
Moving Averages remain in a bearish alignment:
-
MA5 (14.09) < MA10 (14.17) < MA20 (14.40) < MA40 (14.84) < MA60 (14.76)
Price is still trading below all major moving averages, meaning overhead resistance remains a significant technical hurdle.
KDJ Momentum Indicator (9,3,3): K at 50.96, D at 33.94, and J at a notably elevated 85.01. All three lines have surged out of oversold territory, with the J-line leading — a classic signal of rapid short-term momentum recovery. However, the elevated J value also raises caution flags for near-term overbought conditions.
Volume and Open Interest: Friday’s volume reached 128,258 lots, with open interest at 507,492 lots — an increase of 8,547 lots from the prior session. Rising open interest alongside rising prices is a technically bullish signal, suggesting fresh long positions are entering the market.
Key takeaway: Short-term oversold bounce signals are confirmed, but the cluster of moving averages between MA20 (14.40) and MA60 (14.76) forms a dense resistance zone. Sustaining a breakout above these levels will be the pivotal test for bulls in the sessions ahead.
Bullish Drivers
1. Indian Monsoon Deficit Dominates Sentiment
The primary catalyst behind this week’s rally is weather risk in India. According to India’s Meteorological Department, cumulative monsoon rainfall as of June 26 is running 42% below the historical average. India’s Ministry of Earth Sciences has warned that this monsoon season could be the weakest in 11 years.
The June–September monsoon window is critical for sugarcane development, and India is the world’s second-largest sugar producer. A sustained rainfall deficit threatens both cane yields and sugar output, injecting meaningful supply-side uncertainty into the market.
2. Brazilian Fundamentals Offer Structural Support
Data from Brazil’s sugarcane industry association Unica shows that cumulative sugar production in the Center-South region reached 6.84 million metric tons through June 1 of the 2026/27 crop season — down 2% year-over-year.
More significantly, the sugar-to-ethanol mix has shifted materially: the share of cane crushed for sugar fell from 50.09% to 41.42%, while ethanol’s share rose to 58.58%. With ethanol economics remaining attractive relative to sugar, mills are diverting more cane toward fuel production — effectively tightening sugar supply and lending structural support to prices.
3. Global Supply-Demand Balance Tips into Deficit
Commodity advisory firm Czarnikow has revised its 2026/27 global sugar balance from a 1.4-million-MT surplus to a 100,000-MT deficit, citing the continued diversion of Brazilian cane toward ethanol as the primary driver. Other industry forecasters are similarly shifting toward a tighter supply outlook, reinforcing the bullish fundamental narrative.
Bearish Risks to Watch
While Friday’s rally was driven by converging bullish factors, several downside risks remain in play:
-
Strait of Hormuz reopening: The resumption of normal shipping traffic through this critical maritime chokepoint eases global trade disruption concerns. Lower freight, insurance, and fuel costs could gradually weigh on commodity prices, including sugar, over the medium term.
-
El Niño monitoring: Although El Niño conditions are expected to suppress rainfall across key sugar-producing regions — Brazil, India, and Thailand — some degree of weather risk premium may already be priced in. Actual meteorological data in coming weeks will be critical.
-
Technical resistance overhead: As outlined above, the MA20–MA60 band (14.40–14.76 cents) represents a substantial resistance cluster. Short-term bulls will need to confirm a clean breakout to validate continued upside momentum.
ynsugar Team Outlook
The 13.74 cents/lb low on the October contract is increasingly looking like a meaningful near-term floor, supported by both technical and fundamental factors converging simultaneously.
This week’s rally reflects a combination of oversold technical conditions and genuine fundamental improvement — specifically the Indian monsoon deficit, Brazil’s reduced sugar-to-cane ratio, and the global supply balance flipping into deficit. These three factors form the core bullish thesis.
Bull case: If monsoon rainfall remains well below normal, Brazil’s ethanol mix stays elevated, and the global deficit narrative deepens, October raw sugar has room to challenge 14.84 cents (MA40) and potentially test the psychological 15.00 cents level.
Bear case: A meaningful improvement in Indian monsoon coverage or a reversion in Brazil’s sugar-cane ratio would significantly undercut bullish momentum and likely cap the rebound.
This analysis is provided for informational purposes only and does not constitute financial or trading advice. All data referenced is sourced from publicly available market reports and industry associations.