The EU sugar industry 2026/27 outlook reflects a complex and shifting landscape in the global sweet market. The European Union occupies an unusual position in the world sugar economy. It is the world’s leading beet-sugar producer and one of the largest sugar markets overall, according to the European Commission’s sugar policy overview. That position is often reduced to a few headline numbers, but the EU market is more complicated than a simple producer-versus-importer label. Beet output, imported cane sugar, food manufacturing, bioethanol, stocks and trade rules all interact, while different statistical systems count different parts of the flow.
This article uses the European Commission’s August 27, 2026 sugar balance sheet as the current reference point. It cross-checks consumption and conversion issues against the USDA April 2026 EU Sugar Annual, and uses Eurostat, EUR-Lex and Commission policy documents for population and legal context. SugarBrain’s internal EU records were used to check historical continuity, but newer and more authoritative public data take precedence. All figures below are rounded, and forecasts are identified as forecasts.
EU Sugar Market at a Glance
| Metric | 2024/25 Final | 2025/26 Estimate | 2026/27 Early Estimate | Definition / Scope |
|---|---|---|---|---|
| Sugar production | 16.57 Mt | 16.58 Mt | 13.40 Mt | European Commission, white-sugar equivalent |
| Imports | 1.45 Mt | 1.73 Mt | 2.35 Mt | Commission balance-sheet imports |
| Exports | 4.22 Mt | 4.10 Mt | 3.10 Mt | Includes sugar equivalent in processed products |
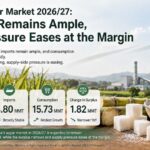
| Consumption/disappearance | 13.61 Mt | 13.45 Mt | 13.39 Mt | White-sugar-equivalent balance-sheet measure |
| Ending stocks | 2.30 Mt | 3.06 Mt | 2.32 Mt | End of marketing year |
| Beet area | 1.512 Mha | 1.336 Mha | 1.224 Mha | Beet area intended for sugar production |
The table is a starting point, not a single “EU sugar balance” that can be compared with every other database. The marketing year runs from October to September, and the Commission’s balance sheet includes sugar equivalent in processed products. The area and production estimates for 2026/27 are early estimates and can change as the crop develops.
Why the EU Is the World’s Beet-Sugar Center
The Commission describes the EU as the world’s leading beet-sugar producer, with around half of global beet-sugar output. Beet sugar itself accounts for only about one-fifth of total world sugar production because cane dominates the global market. Europe’s advantage comes from a combination of temperate growing conditions, high-yield agriculture, established factories, research capacity and a dense food-processing industry.
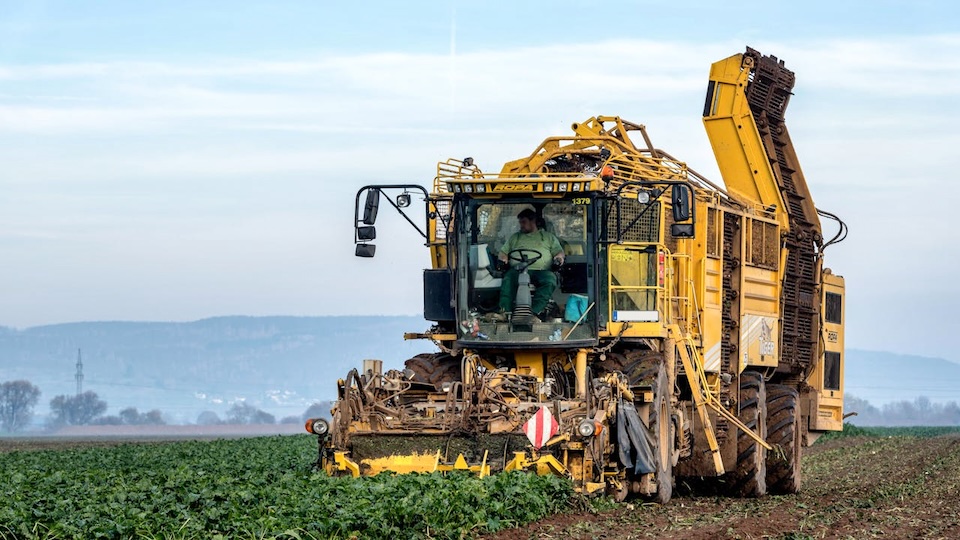
The main production belt runs across northern France, Germany, the Netherlands, Belgium and Poland, with important volumes in the Czech Republic, Austria, Denmark, Sweden, Finland, Slovakia, Lithuania and Hungary. Spain, Italy, Croatia and Romania also contribute to the EU total. Factories are generally close to beet fields because roots are bulky to transport and lose quality during prolonged storage.
Country rankings can move with weather and yields. In final 2024/25 Commission data, Germany produced about 4.71 million tonnes of sugar, metropolitan France 4.38 million tonnes, Poland 2.58 million tonnes, the Netherlands 1.08 million tonnes and Belgium 0.58 million tonnes. For the early 2026/27 estimate, metropolitan France moves ahead of Germany at about 3.89 million tonnes, followed by Germany at 3.50 million tonnes and Poland at 2.22 million tonnes.
The concentration of production is an important commercial fact. France, Germany and Poland together represent roughly 72% of the Commission’s early 2026/27 EU estimate. Adding the Netherlands and Belgium brings the share to about 84% when France’s overseas production is included. A disease outbreak, drought or contracting decision in one of these countries can therefore affect prices and trade across the entire bloc.
What Changed After the 2017 Quota Reform?
EU sugar quotas and associated support arrangements were created in 1968 to protect supply and farm income. Over time, the policy became increasingly difficult to reconcile with global competition and changing Common Agricultural Policy priorities. The quota system ended on September 30, 2017, at the close of the 2016/17 marketing year, and the former regulated minimum beet price was removed. The European Commission documented the transition in its end-of-quota factsheet.
The reform was market-oriented, but it did not eliminate public policy. Sugar remains within the Common Market Organisation. Member states can use decoupled direct payments and, in some cases, voluntary coupled support for sugar beet. The EU also retains tariff-rate quotas, preferential access, market-disturbance measures and private-storage tools. The correct description is therefore “more market-exposed,” not “entirely deregulated.”
The post-quota period showed both sides of competition. Higher output and export opportunities rewarded efficient operators, while abundant availability and weak world prices pressured domestic prices. Factory consolidation, contract discipline and closer attention to energy costs became more important. The 2026/27 acreage cut is a clear example of supply responding to lower returns.
The 2026/27 Production Correction
The Commission’s August 2026 early estimate places EU sugar production at about 13.40 million tonnes, down from 16.58 million tonnes in 2025/26. That is a reduction of roughly 19%. The estimate is lower than the Commission’s June baseline of approximately 14.13 million tonnes, showing how quickly the outlook changed as new area and yield information became available.
Area is the first adjustment channel. Sugar-beet area rose to about 1.512 million hectares in 2024/25, fell to 1.336 million hectares in 2025/26 and is provisionally estimated at 1.224 million hectares for 2026/27. The two-year contraction is close to 19%, bringing the planted area to its lowest level in the Commission’s recent series.
Yield is the second channel. The Commission’s sugar-yield assumption falls from 12.33 tonnes per hectare in 2025/26 to 10.9 tonnes per hectare in 2026/27. This is sugar yield, not harvested beet-root yield. That distinction matters because root tonnage, sugar content, extraction efficiency and final white sugar are different measurements.
The economic cause is straightforward but not sufficient on its own: high prices encouraged planting after the 2022/23 squeeze, while subsequent supply recovery, imports and lower world prices reduced the incentive to maintain acreage. Field costs, energy, crop-protection constraints and weather risk determine whether a farmer chooses beet over cereals or oilseeds. The market response is therefore a combination of price signals and agronomic risk.
Consumption: Why 13.4 Million Tonnes Is Not the Only Number
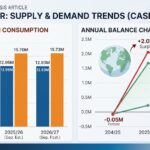
The Commission’s balance sheet estimates EU sugar consumption or disappearance at 13.45 million tonnes in 2025/26 and 13.39 million tonnes in 2026/27, both on a white-sugar-equivalent basis. In the same balance sheet, industrial use is about 0.60 million tonnes and bioethanol use about 0.95 million tonnes. The remainder is recorded as other use within the balance-sheet framework.
USDA’s April 2026 EU Sugar Annual reports a different measure: human domestic consumption of 15.9 million tonnes for both 2025/26 and 2026/27, expressed as raw-sugar equivalent. The difference is not automatically an error. It reflects different definitions, conversion factors and balance-sheet treatment. A responsible article should show the basis next to the number instead of selecting the largest figure for effect.
Dividing the USDA figure by Eurostat’s estimated EU population of 452 million produces an apparent supply figure of roughly 35.2 kilograms per person. It is not a nutrition-survey result and does not mean that every resident consumes 35.2 kilograms of sugar. Per-capita comparisons are meaningful only when the commodity basis, population date, geography and treatment of industrial uses are aligned.
Demand is unlikely to grow rapidly. Reformulation, health awareness, demographic change and alternative sweeteners create long-term pressure. Yet sugar remains technically important in bakery, confectionery, beverages, dairy, preserves and fermentation. The most defensible outlook is gradual structural decline or stability, interrupted by short-term changes in prices, inventories and industrial activity.
Trade: Read the Definition Before Reading the Headline
The Commission’s final 2024/25 balance sheet records approximately 1.45 million tonnes of imports and 4.22 million tonnes of exports. The export figure includes about 2.57 million tonnes of sugar equivalent embedded in processed products, leaving roughly 1.65 million tonnes of sugar exported “as such.” This is why a balance sheet can show large exports while customs data for sugar itself show a much smaller number.
The distinction remains important in 2025/26. The August balance sheet estimates full-year imports at 1.73 million tonnes and exports at 4.10 million tonnes. The Commission’s August 27 trade report, however, shows 768,000 tonnes of normal-regime CN 1701 imports and 1.413 million tonnes of exports during the first ten months of the marketing year. The customs report is a partial-year and product-code view, not a replacement for the full balance sheet.
For 2026/27, the Commission’s early balance points to higher imports of 2.35 million tonnes, lower total exports of 3.10 million tonnes and ending stocks of about 2.32 million tonnes. The projected decline in stocks suggests that the smaller domestic crop could absorb some of the surplus accumulated in 2025/26, although actual trade will depend on prices, preferential access and crop results.
Ukraine, Inward Processing and Policy Risk
The EU sugar market is shaped by preferential access as well as by production. Developing countries can receive duty-free access through the Everything But Arms arrangement or Economic Partnership Agreements, while other suppliers use tariff-rate quotas. Ukraine’s temporary trade arrangements increased its access to the EU market after Russia’s invasion, and safeguard measures were later adjusted as political and market pressures changed.
Inward processing became the most visible policy dispute in 2026. The customs procedure allows non-EU goods to enter duty-free for processing and re-export. Beet growers argued that low-priced raw cane sugar refined into white sugar displaced EU-origin sugar and weakened prices. Refiners and food exporters argued that the procedure helped them remain competitive in international markets.
Commission Implementing Regulation (EU) 2026/1124 suspended inward processing for specified raw cane sugar used to make white sugar until May 27, 2027, with transitional provisions. It does not cover every sugar flow: white sugar used by downstream exporters and raw sugar processed without refining are excluded. The regulation is listed as in force, but the measure is also subject to General Court case T-351/26, so the legal and commercial position remains subject to developments.
The policy lesson is broader than this single regulation. EU sugar competitiveness depends on how the bloc balances domestic beet production, cane refining, food-export competitiveness, preferential partners and consumer affordability. A policy that supports one part of the chain can raise costs or reduce flexibility for another part.
Sustainability: Evidence, Limits and the “Green Sugar” Problem
The EU’s Farm to Fork Strategy, adopted in May 2020 under the European Green Deal, addresses sustainable food production, consumer information, pesticide use, reformulation and the environmental footprint of food processing. It creates a policy direction for sugar, but it should not be presented as a universal official “green sugar” certification.
Beet sugar has circular-economy opportunities. Beet pulp can be used as feed or a biogas feedstock, molasses can support fermentation and feed markets, and process water can be reused. At the same time, factories consume substantial heat to evaporate water during a short campaign. Farm-level emissions, soil health, disease management, nitrogen use and the availability of plant-protection products remain material issues.
The Confederation of European Sugar Manufacturers reports that EU beet-sugar factory emissions fell by 59% between 1990 and 2021. This is a sector-organisation claim with defined methodological boundaries, not proof that every sugar product has the same footprint. Readers should distinguish factory emissions from field emissions and should require a stated boundary before comparing sustainability claims.
Three Scenarios for the 2026/27 Market
The following scenarios are editorial analysis based on the Commission baseline; they are not official forecasts.
- Baseline — managed tightening: Production approaches the Commission’s 13.40-million-tonne estimate, imports rise toward 2.35 million tonnes and exports decline. Stocks fall, but the carry-in cushion prevents an immediate physical shortage. Prices could stabilize if demand remains close to the balance-sheet estimate.
- Downside — weather or yield disappointment: If realized sugar yield falls below the 10.9-tonne-per-hectare assumption, imports may need to rise further and processors could compete more aggressively for available raw material. The impact would be most visible in the major beet belt and in white-sugar premiums.
- Upside — yield recovery with weak demand: If growing conditions improve and sugar content recovers, production could outperform the early estimate while consumption remains restrained. That combination would rebuild stocks and keep pressure on producer margins, even if the physical market looks comfortable.
These scenarios show why the headline production number is not enough. The commercial outcome depends on the interaction of yield, stocks, imports, export demand, processing rules and the price response of growers in the next planting cycle.
What Buyers and Analysts Should Monitor
Five indicators deserve priority: realized sugar yield; final beet contracting for 2027/28; monthly stocks; normal-regime and preferential imports; and the legal status of the inward-processing suspension. A sixth indicator is the spread between the Commission’s white-sugar-equivalent balance and USDA’s raw-sugar-equivalent series. The spread is not noise: it tells the reader whether two sources are measuring the same thing.
For procurement, a smaller EU crop does not automatically mean a shortage. Carry-in stocks and imports can offset part of the decline, while trade restrictions can change the cost and availability of particular qualities. For producers, a smaller area may support prices but also raises the importance of factory utilization and fixed-cost absorption. For policymakers, protecting beet cultivation without undermining food-export competitiveness remains the central trade-off.
Conclusion
The EU sugar industry is moving through a second transition: first from quota protection to market exposure, and now from post-quota oversupply toward a lower-area, higher-risk production model. The region will remain the global benchmark for beet sugar, but its market position will be decided by more than output. Trade definitions, policy choices, energy economics, farm resilience and traceable sustainability claims will matter just as much.
The most reliable reading of the 2026/27 outlook is therefore conditional. The Commission’s early estimate signals a substantial production correction, higher import dependence and lower exports, but the final balance will be determined by the crop, stocks and policy implementation. Readers should follow the data series together and keep the basis beside every number.
Frequently Asked Questions
Is the EU a net importer or net exporter of sugar?
It depends on the reporting scope and marketing year. The European Commission’s balance sheet includes sugar equivalent embedded in processed food products, while customs data focuses strictly on CN 1701 pure sucrose. The EU frequently runs a net surplus in processed-food sugar while operating as a net importer of physical raw cane.
Why do EU consumption figures diverge between the Commission and USDA?
The European Commission calculates white-sugar-equivalent (WSE) disappearance (including non-food and bioethanol industrial use), whereas the USDA tracks human domestic food consumption on a raw-sugar-equivalent (RSE) basis using a standard 1.087 conversion ratio.
Did the EU introduce an official “green sugar” label?
No universal statutory “green sugar” label exists under the Farm to Fork Strategy. Sustainability metrics remain bound to individual corporate disclosures, voluntary certification standards, and defined carbon accounting boundaries.
Is the 2026/27 production estimate final?
No. The Commission’s 13.40-million-tonne projection is an early baseline. Final production volumes will fluctuate depending on autumn lifting conditions, root sucrose accumulation, and factory campaign duration.
Sources and Editorial Note
Primary public sources include the European Commission Sugar Market Observatory, the Commission’s sugar policy page, the August 2026 sugar balance sheet, the August 2026 trade statistics, Eurostat population data, the USDA April 2026 EU Sugar Annual, EUR-Lex Regulation 2026/1124, and the Commission’s Farm to Fork Strategy.
The article is a desk-research analysis. It does not claim a site visit, grower interview or proprietary forecast.