Executive Summary
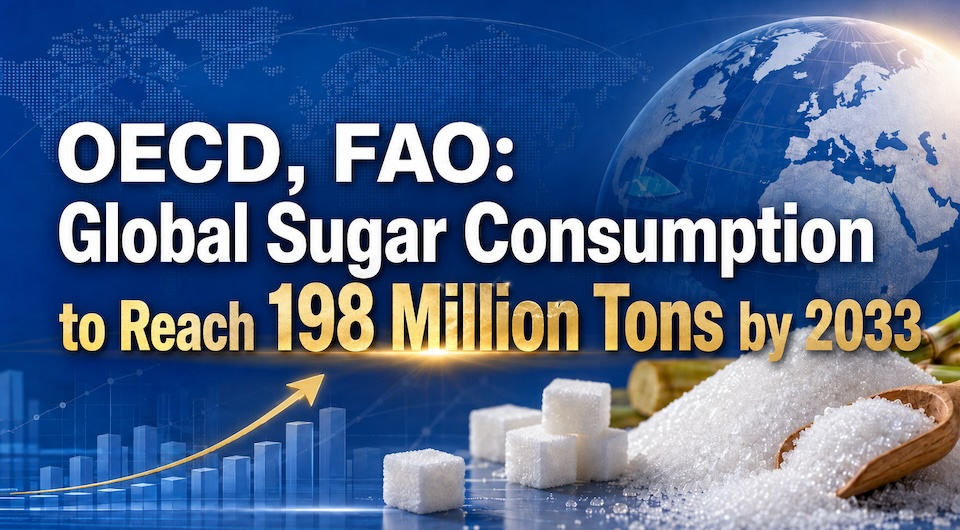
Projections for global sugar consumption 2033 indicate that worldwide demand will reach 198 million metric tons (MT), with global per capita consumption rising to 22.8 kg, according to the OECD-FAO Agricultural Outlook 2024–2033.
Unlike historical cycles driven by Western economies, future growth will not originate from traditional high-volume markets in Europe or North America. Instead, demand expansion is heavily concentrated in developing and low-to-middle-income economies across Asia and Africa, which together are forecast to account for 96% of all new global sugar demand over the coming decade.
┌────────────────────────────────────────────────────────────────────────┐
│               Global Sugar Market Transformation (2024–2033)          │
├────────────────────────────────────────────────────────────────────────┤
│ 1. Global Consumption: Reaches 198M MT by 2033 (+1.2% p.a.)           │
│ 2. Demand Drivers: Asia (64%) & Africa (32%) drive global expansion    │
│ 3. Global Output: Expands to 202M MT (Brazil: 46M MT, India: 38M MT)   │
│ 4. China Outlook: Demand plateaus at 15.7M–15.8M MT amid slow growth   │
└────────────────────────────────────────────────────────────────────────┘
Macro Background & Regional Demand Shifts
The OECD-FAO Agricultural Outlook (using 2021–2023 as the base period) forecasts global sugar consumption to grow at an average annual rate of 1.2%, expanding total volume from baseline levels to 198 million MT by 2033. Per capita consumption is projected to rise by 4% to 22.8 kg.
However, regional growth paths are diverging sharply:
-
High-Income Economies (Europe, North America, Oceania): Health awareness, reformulation initiatives, sugar-sweetened beverage (SSB) taxes, and front-of-pack labeling continue to suppress per capita sugar consumption.
-
Developing Economies (Asia & Africa): Lower initial consumption baselines combined with rapid population growth, urban migration, and rising disposable incomes provide significant runway for expansion.
Asia: The Engine of Global Growth (64% of New Demand)
Asia will contribute approximately 64% of total new global demand through 2033. India and Indonesia remain primary engines due to surging populations and expanding food-processing industries.
In China, despite demographic headwinds, tier-2, tier-3, and developing cities are experiencing food consumption upgrades. By 2033, China’s per capita sugar consumption is projected to reach 12.8 kg—still well below the global average of 22.8 kg.
Africa: Low-Baseline Expansion (32% of New Demand)
Africa will account for 32% of new global demand. In Sub-Saharan Africa’s Least Developed Countries (LDCs), direct sugar consumption is accelerating. Because local refining capacity cannot keep pace with demand, imported sugar will represent roughly 69% of Africa’s total sugar consumption by 2033.
Global Supply Dynamics & Supply Concentration
Global sugar production is forecast to grow by 14% from baseline levels to 202 million MT by 2033. Supply will remain highly concentrated in three primary producing nations:
-
Brazil: Output projected at 46 million MT (~23% of global supply). Exports are expected to expand by 6.5 million MT to reach 36 million MT by 2033.
-
India: Output projected at 38 million MT (~19% of global supply).
-
Thailand: Output expected to increase by 4.4 million MT over 2023 levels.
Both Brazil and India face ongoing competition between sugar and ethanol production. Brazilian mills dynamically allocate sugarcane based on relative price spreads between hydrous ethanol and raw sugar, while India’s mandatory E20 ethanol-blending policy diverts sucrose away from crystal sugar.
Trade Structure: Raw vs. Refined
Raw sugar is projected to maintain its dominance, accounting for roughly 59% of global sugar trade through 2033. Large exporters ship raw sugar via bulk vessels to destination refineries in importing nations. However, refined (white) sugar imports are growing at a faster percentage rate, particularly in African markets lacking domestic refining infrastructure.
Structured Outlook Data Tables
Table 1: Global Sugar Baseline vs 2033 Projections (OECD-FAO)
| Market Metric | Base Period (2021–23) | Projected 2033 | Net Growth / Change |
| Global Consumption | ~175.0 Million MT | 198.0 Million MT | +23.0 Million MT (+1.2% p.a.) |
| Global Per Capita Consumption | ~21.9 kg | 22.8 kg | +4.1% |
| Global Production | ~178.0 Million MT | 202.0 Million MT | +24.0 Million MT (+13.5%) |
| Brazil Production | ~38.0 Million MT | 46.0 Million MT | +8.0 Million MT |
| Brazil Exports | ~29.5 Million MT | 36.0 Million MT | +6.5 Million MT |
| India Production | ~33.0 Million MT | 38.0 Million MT | +5.0 Million MT |
Table 2: Regional Contribution to New Global Sugar Demand (2024–2033)
| Region / Market | Share of New Demand (%) | Primary Growth Drivers |
| Asia (Excl. High-Income) | 64% | Population growth, rising income, food & beverage processing expansion |
| Africa | 32% | Low per-capita baseline expansion, urban migration, LDC growth |
| Rest of World | 4% | Stagnant or contracting per-capita growth due to health policies |
Table 3: China Sugar Consumption Plateau (USDA & MARA Data)
| Marketing Year / Forecast | MARA Forecast (Million MT) | USDA Estimate (Million MT) | Per Capita Baseline (kg) |
| 2024/2025 | 15.67 | 15.80 | ~11.5 kg |
| 2025/2026 | 15.70 | 15.80 | ~11.8 kg |
| 2026/2027 (E) | 15.73 | 15.80 | ~12.0 kg |
| 2033 Target (OECD-FAO) | — | — | 12.8 kg |
China Market Dynamics: Consumption Plateau vs Long-Term Growth
China’s domestic sugar consumption has entered a distinct plateau phase:
-
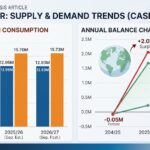
Short-Term Baseline: According to the Ministry of Agriculture and Rural Affairs (MARA) CASDE report, domestic sugar consumption is estimated at 15.67 million MT in 2024/25, 15.70 million MT in 2025/26, and projected at 15.73 million MT in 2026/27. USDA forecasts similarly anchor consumption at 15.80 million MT.
-
Consumption Structure: Industrial sugar use accounts for 60% of Chinese demand (led by beverages, dairy, confectionery, baking, and canned goods), while direct household/catering consumption accounts for 40%.
-
Growth Inhibitors: Rapid adoption of alternative sweeteners (starch sugar, erythritol, stevia), zero-sugar beverage trends, and aging demographics continue to offset growth from expanding ready-to-drink tea and coffee chains.
While OECD-FAO foresees Chinese per capita consumption edging up to 12.8 kg by 2033, near-term growth will remain gradual rather than explosive.
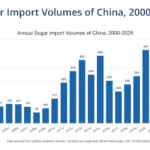
📊 Explore In-Depth Import Trends: For comprehensive historical data, tariff structures, and real-time updates on Chinese raw sugar trade, read our complete guide on China Sugar Import Report & Analysis.
Expert Commentary & Key Takeaways
ynsugar Analyst Desk Commentary:
“The 2033 OECD-FAO outlook highlights a structural realignment in global trade flows. The concentration of 96% of new demand in Asia and Africa shifts the physical trade focus toward raw sugar refining hubs and direct white sugar trade into African ports.
For market participants tracking China, domestic consumption remains firmly anchored between 15.7M and 15.8M MT. Lower per capita consumption figures relative to global averages should not be interpreted as a guarantee of rapid import growth. Chinese import demand will continue to be governed by import margins, local stock absorption, and government quota management rather than immediate consumption expansion.”
Disclaimer: Global sugar market projections presented in this report are based on data published in the OECD-FAO Agricultural Outlook 2024-2033, USDA FAS, and China MARA. This analysis is provided for market intelligence and educational purposes only and does not constitute financial, investment, or commercial trading advice.