As we move into the second half of the year, the El Niño 2026 sugar market fundamentals are becoming increasingly complex…By Ynsugar Research Published: May 2026
Executive Summary
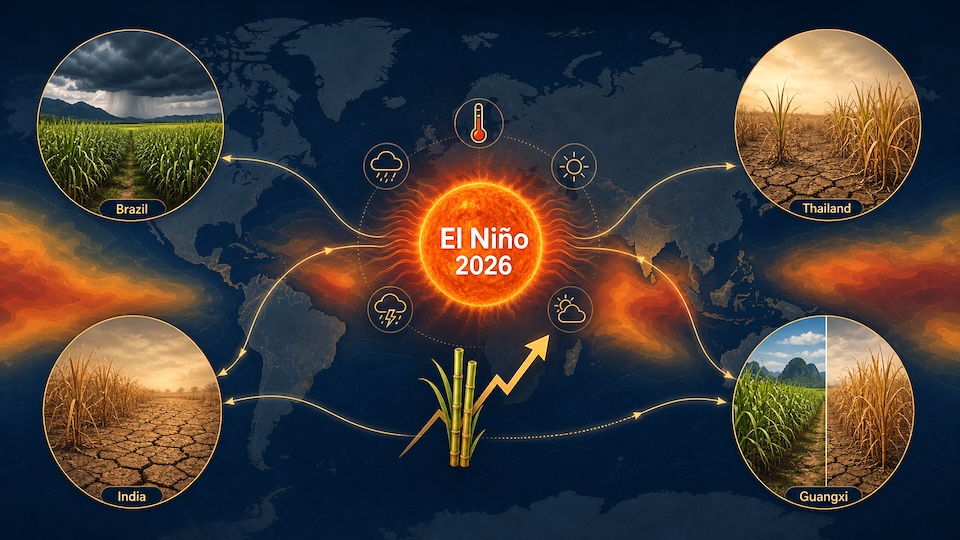
The second half of 2026 is shaping up to be a pivotal inflection point for global sugar fundamentals. Climate signals point to a rapid transition from ENSO-neutral to El Niño conditions, with model ensembles flagging a non-trivial tail risk of a “super” event that could outpace the 1997 and 2015 episodes in intensity.
Based on a synthesis of forecasts from major climate monitoring centers and a historical replay of analogous events, this outlook examines what an emerging El Niño means for the four largest sugarcane producers — Brazil, India, Thailand, and China — and what it implies for both the Zhengzhou domestic contract (ZCE) and the ICE No. 11 international benchmark.
For China specifically, the stakes are unusually high. The 2025–26 crushing season is the third consecutive year of production growth exceeding one million tonnes, with output potentially reaching 12.9 million tonnes — the highest since the 2013–14 season. Whether the 2026–27 season marks a supply-demand inflection point or extends the growth cycle depends, in large part, on what El Niño does to Guangxi.
1. Climate Outlook: Accelerating Transition Toward El Niño
The consensus across major climate agencies is that the equatorial Pacific is in the final stages of an ENSO-neutral phase and warming rapidly.
-
NOAA’s Climate Prediction Center: Places an 80% probability on ENSO-neutral conditions through April–June 2026, with El Niño likely to emerge in May–July 2026 (61% probability) and persist through at least the end of the year.
-
The Columbia/IRI Model Plume: More aggressive, placing the probability of El Niño remaining dominant through the rest of 2026 at 88–94%.
Critically, successive forecast updates have trended stronger, not weaker. The majority of model forecasts now assign at least a 50–50 chance that this El Niño becomes a “super” event — defined as sea surface temperatures (SST) at least 2°C above average. The projected 2026 intensification currently outpacing the early evolution of both the 1997 and 2015 super events. The market-relevant baseline is approximately a 25% probability of a strong-to-very-strong event by year-end.
[Market Baseline Scenario Projection]
┌─────────────────────────────────┬──────────────────┐
│ ENSO Scenario (By Year-End 2026)│ Probability      │
├─────────────────────────────────┼──────────────────┤
│ Moderate/Strong El Niño         │ ~75% (Baseline)  │
│ "Super" El Niño (>2.0°C SST)    │ ~50% (Tail Risk) │
└─────────────────────────────────┴──────────────────┘
A Note on the New RONI Index
Analysts must update their methodology immediately. In February 2026, NOAA’s Climate Prediction Center officially replaced the traditional Oceanic Niño Index (ONI) with the Relative Oceanic Niño Index (RONI).
Why RONI Matters: RONI accounts for long-term background ocean warming trends that ONI systematically ignored. The practical consequence for commodity analysts is material: RONI will generally dampen the apparent strength of El Niños and amplify La Niñas relative to historical ONI readings. All historical comparisons and event classifications must be re-anchored to this new index to avoid over-interpreting baseline anomalies.
Forecast Confidence and Its Limits
Forecast humility is warranted. Global and western Pacific sea surface temperatures in early 2026 were warmer than at the equivalent point in 2023, and greenhouse gas radiative forcing continues to rise — pushing the climate system into territory where model physics are less well-calibrated. Cloud feedbacks and aerosol interactions remain imperfectly represented. An El Niño that the atmosphere fails to respond to in the expected pattern would deliver a materially smaller supply impact than the headline SST anomaly implies.
2. Producer-by-Producer Impact Analysis
El Niño shapes sugar supply through two primary channels — precipitation and temperature — but the transmission mechanism differs substantially across the four leading producers.
┌──────────┬─────────────────────────────┬──────────────────────────────────────────┐
│ Producer │ Climate Impact Channel      │ Primary Market Transmission Mechanism    │
├──────────┼─────────────────────────────┼──────────────────────────────────────────┤
│ Brazil   │ Above-average Rainfall      │ Suppresses ATR; Sugar-Ethanol Parity Shift│
│ India    │ Monsoon Deficit / Drought   │ Reduces Yield; Ethanol Diversion Policy  │
│ Thailand │ Severe Drought Risk         │ Double Blow to Cane Tonnage & Quality    │
│ China    │ Shifting Rainfall (Guangxi) │ May–July Drought Stress vs. Crop Growth   │
└──────────┴─────────────────────────────┴──────────────────────────────────────────┘
🇧🇷 Brazil: Yield Up, ATR Down, Mix Is the Swing Factor
In Brazil’s Center-South, El Niño typically delivers above-average rainfall, which supports cane tonnage but suppresses sucrose concentration (ATR). The 2015–16 episode was instructive: heavy rainfall disrupted harvesting logistics and slowed crushing pace, contributing to the subsequent price rally.
The decisive variable for sugar output, however, is not cane volume but the sugar-ethanol allocation. With the sugar-ethanol parity having recently turned positive, the question of whether mills sustain a low sugar mix is genuinely unresolved. Higher crude oil prices boost ethanol profitability, creating a direct incentive to divert cane away from sugar — a supply constraint that could partially offset any volume-driven bearish narrative.
🇮🇳 India: Monsoon Failure and the Ethanol Offset
India is the textbook El Niño loser. The 2023–24 El Niño delivered India’s weakest monsoon in five years — 6% below the long-run average — with sugar production declining roughly 11.2% year-on-year for the 2023–24 season. Yields, sucrose recovery, and final output are all typically pressured.
However, India carries an important offset: the government can redirect 3–4 million tonnes from its ethanol diversion programme back into sugar supply, which absorbs most of the production loss in moderate scenarios. A severe monsoon failure combined with simultaneous losses across Asia would be required to produce a major price impact from India alone.
🇹🇭 Thailand: Volume and Quality Both at Risk
Thailand’s exposure mirrors India’s but is even more sensitive to the timing and geographic distribution of rainfall. The 2023–24 episode reduced Thai production to an estimated 7–8 million tonnes, down from 11 million tonnes the prior season, with exports falling 30–40%.
Critically, El Niño damaged not just tonnage but sucrose quality — a double constraint for exportable supply. For 2026, analysts should monitor the monsoon onset date and its spatial distribution across the cane belt, not just cumulative seasonal totals.
🇨🇳 China and Guangxi: The Critical Variable for 2026–27
China’s story is the most structurally important for the upcoming season, and it requires a more granular analysis than previous El Niño market assessments have provided.
-
The Production Cycle Context: The 2025–26 season is the third consecutive year of output growth exceeding one million tonnes, with total national production potentially reaching approximately 12.9 million tonnes — a level not seen since the 2013–14 season. Three years of consecutive growth above that threshold is historically rare. The question for 2026–27 is whether the cycle extends or breaks.
-
Guangxi is the Market: Guangxi produces more than two-thirds of China’s total sugar output. Any meaningful shift in Guangxi’s cane area or unit yield translates directly into national supply.
-
Historical Precedent: When production losses occur in Guangxi, they tend to be large and driven by two compounding mechanisms: prolonged low prices that reduce planted area, and extreme weather that suppresses unit yield. The last strong El Niño episode (centered on the 2014–15 season) coincided with a reduction of over two million mu in Guangxi’s planted cane area, causing production to fall by approximately 2.2 million tonnes to 6.34 million tonnes.
-
The Current Structural Difference: As of mid-2026, Guangxi’s planted cane area shows no clear downward trend. Policy support has stabilized the industry, and cane seedling conditions entering the season are assessed as neutral-to-favorable. The area-contraction risk that amplified the 2014–15 damage is therefore substantially lower heading into 2026–27. This means weather becomes the dominant remaining variable.
-
The Precipitation Transmission Channel: Statistical analysis indicates a consistent seasonal precipitation pattern in Guangxi during El Niño years: the pre-flood season (April–June) tends to see above-average rainfall, while the post-flood season (July–September) shifts toward drought. If the 2026 event achieves moderate-to-strong intensity, the May–July window represents the peak risk period for drought-induced stress during the critical jointing and elongation phase—precisely when moisture has the largest influence on final stalk weight and sucrose loading.
The Bottom Line for China: If El Niño delivers meaningful drought stress to Guangxi’s cane crop during the May–September growing window, the unit yield gains of the past two to three seasons will be impossible to sustain. A strong El Niño generating internal production pressure — combined with simultaneous supply tightening from India and Thailand — would represent the high-conviction bullish scenario for domestic ZCE prices.
3. Market Implications: Pricing the Risk Premium
The forward market is already digesting the climate signal. Trading firm Czarnikow cut its global surplus estimate for 2026–27 to 1.1 million tonnes from 3.4 million in its February update, citing El Niño risks across major exporters.
However, a critical lag effect frequently misleads near-term positioning: strong El Niños hurt agricultural yields, but the supply impact typically arrives 6–12 months after the climate event peaks. The meaningful price-discovery window most likely opens in late Q2 and runs through Q3 2026.
📈 Domestic China Sugar (Zhengzhou / ZCE)
Near term, the progressive release of out-of-quota import licenses is expected to maintain supply-demand balance, capping the upside. Geopolitical friction around Middle Eastern shipping lanes — where concerns over the Strait of Hormuz have curbed an estimated 6% of global sugar trade flows according to Covrig Analytics — provides a floor via elevated import cost premia.
-
Base Case Trading Range: RMB 5,300–5,500/tonne appears reasonable. The upper bound is constrained by physical availability, while the lower bound is firmly supported by landed import costs and freight risk premia.
-
The Breakout Scenario: A confirmed deterioration in Guangxi crop conditions during the May–September window, combined with a tighter import licensing environment, carries a non-trivial probability of breaking this range to the upside.
🌐 International Sugar (ICE No. 11)
The medium-term asymmetry sits clearly with the international benchmark. Three variables will shape the Q4 2026 picture: Brazil’s sugar-ethanol allocation through Q3, final Indian production numbers, and the trajectory of El Niño-driven monsoon disruption across Asia.
A credible monsoon failure scenario in India alone could shift the Indian balance by 4–5 million tonnes on the downside, partially offset by 3–4 million tonnes of ethanol redirection. The pivotal bull scenario requires synchronized Northern Hemisphere crop damage: confirmed drought stress in Guangxi, a below-average Indian monsoon, and sustained drought in Thailand’s cane belt. On balance, the international benchmark carries materially greater asymmetric upside than the Zhengzhou domestic contract over the medium term.
4. Key Risk Factors to Monitor
This outlook is conditional on a complex set of interacting variables:
-
El Niño Intensity Surprises: Downside (weaker event leaving Asian production intact) vs. Upside (super event exceeding 1997/2015 precedents).
-
Guangxi Seedling Dynamics: Any late-season planted area adjustments driven by shifting domestic sentiments.
-
Brazil Sugar-Ethanol Mix: The direction and magnitude of mill allocation decisions through Q3 2026 driven by international crude prices.
-
India Policy Response: The speed and scale of any government-mandated ethanol-to-sugar redirection.
-
Geopolitical Friction: Continued Middle East shipping lane disruptions adding physical friction and import cost floors to domestic Chinese prices.
Conclusion
The 2026 El Niño is transitioning from forecast to near-certainty, with model agreement at unusually high levels. For China’s sugar market, the stakes are higher than in previous cycles: a third consecutive year of above-trend output has set up 2026–27 as a potential inflection season. Guangxi’s cane crop faces its highest weather-related risk in over a decade, with the May–September growing window representing the peak exposure period. Until clearer signals emerge from the fields, domestic prices are likely to remain range-bound, while international benchmarks carry the greater asymmetric upside.
Disclaimer: The information, analyses, and data contained in this report are for informational and educational purposes only. They do not constitute financial, investment, trading, or commercial advice. While the insights provided are based on rigorous synthesis of institutional forecasts and historical market data available as of May 2026, commodity markets are subject to extreme volatility, unpredictable weather changes, and geopolitical shifts.