Understanding U.S. Sugar Consumption is critical for global trade…
The United States has long been associated with a strong sweet tooth, but how does its sugar appetite actually measure up on the world stage in 2024/2025? Drawing on data from S&P Global, the USDA’s Economic Research Service (ERS), and industry trackers, this analysis examines where America stands among major sugar-consuming nations, where in the country sugar is consumed most heavily, and how demand shifts across the calendar year.
The Global Picture: America’s Sweet Tooth in Context
Sugar remains a heavyweight global commodity. For the 2024/25 cycle, global sugar consumption reached approximately 178.8 million metric tons. The United States plays a significant role in this total: domestic consumption has steadily climbed over the past decade, rising from roughly 10 million metric tons in 2009/10 to over 11 million metric tons in recent years.
When viewed on a per-person basis using S&P Global’s 2024/2025 consumption data, the United States consumes 32.92 kg of sugar per capita — a figure that towers nearly 48% above the global average of 22.24 kg per capita. To put that in perspective, the average American consumes roughly three times the per capita sugar volume of an average Chinese consumer (10.92 kg/person).
Yet the U.S. is not the global leader. Comparing eleven major economies — the United States, Mexico, the European Union, Australia, India, Thailand, Malaysia, Japan, South Korea, Brazil, and China — America ranks sixth, trailing:
Across the 83 countries with available consumption data, the U.S. ranks 41st — squarely mid-pack. The picture changes, however, when filtering for population size:
- Among the 40 countries with populations above 20 million, the U.S. ranks 14th.
- Among countries with populations above 50 million, the U.S. ranks 6th, behind Egypt, Mexico, Colombia, Thailand, and Brazil.
In other words, among the world’s most populous nations, very few consume sugar at a higher per-capita rate than Americans.
These figures align with other independent estimates suggesting strong U.S. demand intensity. Global per capita sugar consumption was 24.2 kg in 2022, down from 24.8 kg in 2018, while the United States has a per capita sugar consumption of 39.7 kg in 2022, including added sugarswhen broader sweetener categories are factored in. (Different sources use different definitions — some count only refined sugar, others include high-fructose corn syrup and added sugars — which explains the spread between the 32.92 kg figure and higher estimates.)
It is worth noting that overall U.S. sweetener intake has been on a slow, steady downward trajectory for health reasons. Per capita sugar and sweetener consumption in the United States will drop 0.2% reaching 120.6 pounds in 2025, continuing a pattern of slow declines from previous years. Following modest rebounds in snack and sweet intake during the COVID-19 pandemic, consumption has resumed its downward trajectory as consumers return to pre-pandemic behaviors and continue to focus on reducing sugar intake for health reasons. Food manufacturers have responded to consumer preferences by curbing or eliminating certain types of sugars, especially high-fructose corn syrup (HFCS), from their products in an effort to appeal to health-conscious markets.
Even so, the USDA’s latest outlook confirms that absolute volumes remain enormous. U.S. 2024/25 sugar deliveries for food and beverage use were set at 12.045 million short ton, reflecting a year-over-year reduction of about 380,000 short ton or 3 percent.
Where Americans Consume Sugar: A Tale of Two Regions
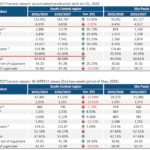
Sugar consumption in the U.S. is far from evenly distributed across the country. Looking at regional consumption data from 2010 to 2024, two geographic blocs dominate the national picture: the Central and Northern region together with the Southern region account for 63% to 67% of total U.S. sugar consumption in any given year.
Central and Northern States: The Industrial Heartland of Sugar Demand
The Central and Northern region is consistently the country’s single largest sugar-consuming zone. Its consumption rose from 3.3682 million metric tons in 2010 to 3.8573 million metric tons in 2024 — a 14.52% increase — and the region has steadily accounted for 34% to 36% of all U.S. sugar consumption over the 15-year window.
This concentration is not accidental. The Midwest and surrounding states form the operational core of America’s food processing and beverage manufacturing industries. From soft-drink bottling lines to confectionery plants, bakeries, and cereal producers, the region’s vast industrial footprint translates directly into elevated industrial sugar demand — the backbone of U.S. consumption volumes.
The South: A Strong Secondary Hub
The Southern region rounds out the dominant duo. Combined with Central and Northern volumes, the two areas form what is effectively the consumption “spine” of the U.S. sugar market — a structural feature that has remained remarkably stable through pandemic disruptions, supply-chain shocks, and shifting consumer health preferences.
Seasonality: Why Summer Sweetens the Books
Sugar consumption in the United States also follows a strong seasonal rhythm, and the pattern holds true across total consumption, industrial use, and non-industrial (household / direct food service) use.
Quarterly averages calculated from 2010–2024 data reveal a clear ranking:
| Quarter | Average Consumption (million tons) | Rank |
|---|---|---|
| Q3 (Jul–Sep) | 2.6981 | Highest |
| Q4 (Oct–Dec) | 2.6147 | 2nd |
| Q2 (Apr–Jun) | 2.5920 | 3rd |
| Q1 (Jan–Mar) | 2.5135 | Lowest |
The “summer-high, winter-low” pattern is closely tied to U.S. climate and consumer habits. Hot summer months drive a surge in demand for sugar-sweetened beverages, ice cream, frozen desserts, and other indulgences, while Q4 receives a holiday-season boost from baking, confectionery, and holiday meals. Cold-weather months at the start of the year see the weakest demand of any quarter.
USDA tracking corroborates these intra-year fluctuations and the importance of monthly delivery pacing to overall market outlook. U.S. 2024/25 sugar deliveries for food and beverage use were reduced from last month by 80,000 STRV to 12.045 million STRV, reflecting a year-over-year reduction of about 380,000 STRV or 3 percent. This decrease is based on the persistent slowdown in deliveries through May for all three entities (beet processors, cane refiners, non-reporters) and on the expectation that the pace will not significantly pick up for the rest of this fiscal year.
What It Means for the Market
Three takeaways emerge from the 2024/2025 data:
- The U.S. is a heavy — but not the heaviest — per-capita sugar consumer. It punches well above the global average and above almost every other large-population country, but trails several middle-income economies in Southeast Asia and Latin America.
- Industrial concentration matters more than household appetite. The disproportionate share of the Central/Northern region in U.S. consumption reflects where food and beverage manufacturers are headquartered, not necessarily where end-consumers eat the most sweets.
- Seasonality is structural, not noise. Procurement teams, refiners, and importers should expect — and continue to budget around — a Q3 peak and a Q1 trough year after year.
Health-driven reformulation, sugar taxes in select jurisdictions, and the rise of non-nutritive sweeteners are likely to keep U.S. per-capita figures on a gentle downward slope. But the regional and seasonal architecture of demand — built around industrial geography and summer beverage culture — appears unlikely to change meaningfully in the near term.
YnSugar Analysis Team:The U.S. sugar market itself is projected to grow from $20.54 billion in 2024 to $32.49 billion by 2033, at a compound annual growth rate of 5.23%. However, this growth is expected to be driven more by value (premium and specialty sugars, alternative sweeteners) than by volume, as health-conscious consumer trends continue to put downward pressure on per-capita intake.
Meanwhile, trade policy adds another layer of complexity. The U.S. maintains a protective sugar import quota system, keeping domestic prices significantly higher than global benchmarks — a 4-pound bag of sugar in a Minnesota Walmart was photographed at over $2/kg in April 2025, compared to $1.40/kg in the UK. President Trump’s 2025 tariff measures have introduced fresh uncertainty for exporters like Mexico and Brazil, which shipped over 1.2 million and 870,000 tonnes respectively to the U.S. in 2024.
Sources: S&P Global 2024/2025 Sugar Consumption Data; USDA Economic Research Service Sugar and Sweeteners Outlook (May & July 2025); USDA Foreign Agricultural Service; Statista; IBISWorld; World Population Review.
Disclaimer: The information provided in this article is for informational and educational purposes only and does not constitute financial, investment, or professional commercial advice. While we strive to use the most recent data from reliable sources such as the USDA and S&P Global, market conditions are subject to rapid change. YnSugar is not responsible for any losses or decisions made based on the content of this analysis.