The latest USDA China Sugar Annual Report, released on April 20, 2026, provides a detailed outlook on the nation’s supply chain…
China Sugar Annual Report: Key Highlights
USDA Foreign Agricultural Service | Report No. CH2026-0051 | April 20, 2026
The USDA Foreign Agricultural Service (FAS) released its latest China Sugar Annual Report on April 20, 2026. The report indicates that China’s sugar production continues to grow, while consumption remains flat and import volumes are expected to decline.
I. Total Sugar Production: Record High Exceeds Forecasts
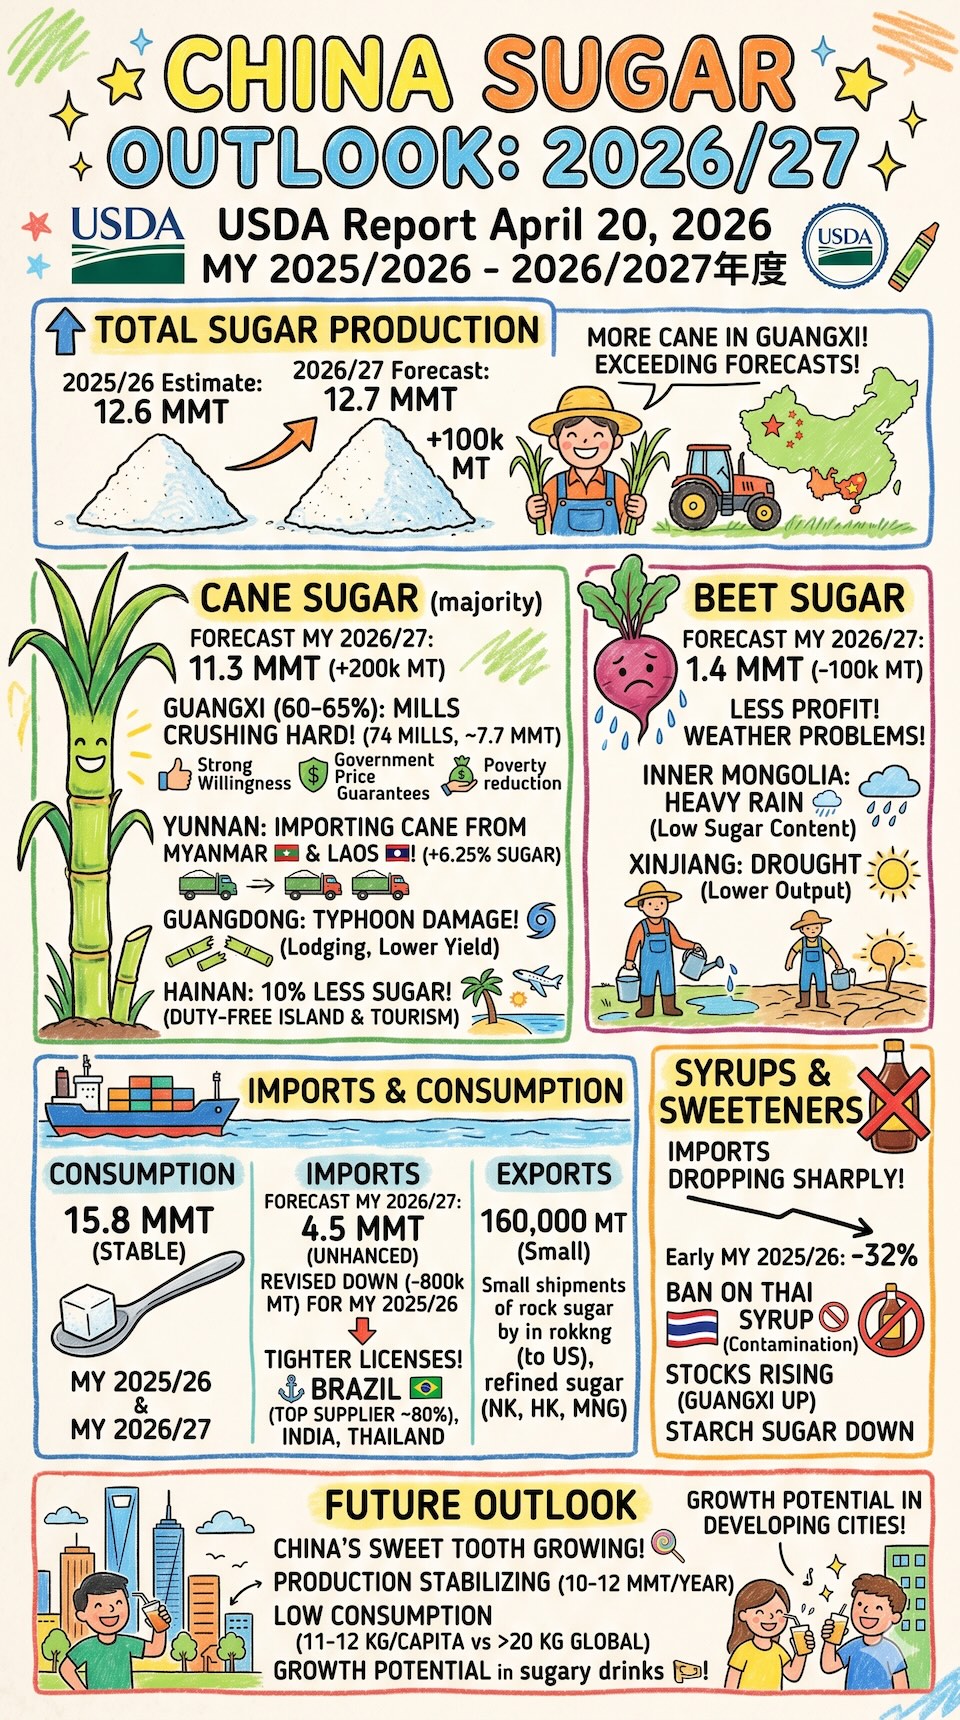
The report projects China’s sugar production for marketing year (MY) 2026/27 will reach 12.7 million metric tons (MMT), an increase of 100,000 MT from the revised 2025/26 estimate. Total sugar production in MY 2025/26 is estimated at 12.6 MMT, exceeding USDA’s previous forecast by 1.1 MMT, driven primarily by increased sugarcane output in Guangxi, the country’s leading production region.
On the consumption side, sugar consumption for both MY 2025/26 and MY 2026/27 is held steady at 15.8 MMT.
II. Cane Sugar Production: Guangxi Expands Acreage, Yunnan Scales Up Imported Cane
National Overview: Cane sugar production for MY 2026/27 is forecast at 11.3 MMT, up 200,000 MT from the revised 2025/26 estimate. Growth is driven by expanded sugarcane acreage in Guangxi and Yunnan’s increased imports of raw sugarcane from neighboring countries such as Myanmar and Laos. Sugarcane planting area for 2026/27 is projected at 1.275 million hectares, up 25,000 hectares from the 2025/26 estimate.
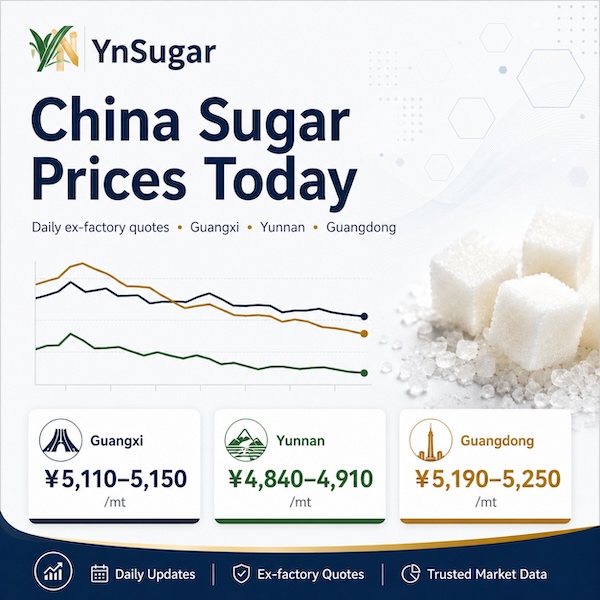
Guangxi: As the country’s primary cane sugar production region, Guangxi accounts for 60–65% of national cane sugar output. Sugar production this crushing season is expected to reach approximately 7.7 MMT, with 74 sugar mills in operation — on par with the previous season. Through the end of March 2026, Guangxi mills had crushed 58.8 million MT of sugarcane, producing 7.4 MMT of sugar — a year-on-year increase of 14.7%. However, the sugar recovery rate fell 0.7 percentage points to 12.6%. Notably, farmer willingness to plant sugarcane remains strong, as competing crops such as citrus are trading below production costs, while sugarcane growers benefit from government-guided purchase price guarantees. Sugarcane cultivation is also being promoted as a regional poverty alleviation measure.
Yunnan: Sugar production this season is estimated at 2.7 MMT, with 52 mills in operation. Through the end of March 2026, Yunnan mills crushed 16.61 million MT of cane and produced 2.01 MMT of sugar, up 6.25% year-on-year. The sugar recovery rate was 12.85%, down 0.23 percentage points from the previous season. From October 2025 through February 2026, Yunnan imported 2.54 MMT of sugarcane — up 8.6% year-on-year — sourced primarily from Myanmar (63%) and Laos (35%). Full-season imports are expected to reach 3.75 MMT, yielding over 450,000 MT of sugar.
Guangdong: Sugar production this season is estimated at 650,000 MT, slightly below the previous year, with 19 mills in operation — one more than in MY 2024/25. Although Guangdong expanded sugarcane planting area, a powerful typhoon in September 2025 caused widespread lodging, significantly reducing cane yield and sugar content. Unlike Guangxi and Yunnan, Guangdong does not set a government-guided sugarcane purchase price.
Hainan: Sugar production in MY 2025/26 is estimated at 50,000 MT, approximately 10% below the previous year. Hainan officially became a duty-free island on December 18, 2025, with its economy increasingly oriented toward tourism.
III. Beet Sugar Production: Adverse Weather Weighs on Output
China’s beet sugar production for MY 2026/27 is projected to decline by 100,000 MT to 1.4 MMT, with planted area falling 10,000 hectares to 205,000 hectares. The primary driver is softening beet purchase prices, which are prompting farmers to shift to more profitable crops. MY 2025/26 beet sugar production is estimated at 1.5 MMT, 100,000 MT below USDA’s previous forecast.
Inner Mongolia: Twelve beet sugar factories operated this season, one more than the previous year. The crushing campaign ran 181 days from September 17, 2025 to March 17, 2026, producing an estimated 685,000 MT of sugar — approximately 20,000 MT more than the prior season. Severe rainfall in late July 2025 — the heaviest since 1956 — disrupted beet development and resulted in low sugar content. Beet purchase prices ranged from RMB 520–560/MT (USD 75–81), down from MY 2024/25 levels.
Xinjiang: Fourteen beet sugar factories operated in MY 2025/26, one fewer than the previous year. From the first half of October 2025 through February 2026, Xinjiang produced approximately 790,000 MT of sugar — down 20,000 MT from MY 2024/25 — primarily due to drought. The previous season had set a record of 810,000 MT. Beet purchase prices were RMB 550/MT (USD 80), down from the prior year.
IV. Trade: Import Forecast Cut Sharply, Brazil Remains Top Supplier
Imports: China’s sugar imports for MY 2026/27 are projected at 4.5 MMT, unchanged from the revised 2025/26 estimate. With domestic production rising and consumption growth stagnant, authorities are expected to tighten import licenses to stabilize sugar prices and protect the interests of domestic growers and mills. The MY 2025/26 import estimate has been revised down to 4.5 MMT, 800,000 MT below USDA’s previous forecast.
China’s sugar imports operate under a tariff-rate quota (TRQ) system: the in-quota tariff rate is 15%, with a total quota of 1.945 MMT — approximately 70% allocated to state-owned enterprises. The out-of-quota tariff stands at 50%. Since July 2020, all out-of-quota sugar imports have required processing through an automatic import licensing system. Brazil is China’s largest sugar supplier, accounting for approximately 80% of total imports, followed by India and Thailand.
Exports: Sugar exports for MY 2026/27 are projected at 160,000 MT, unchanged from the revised 2025/26 estimate. China’s exports consist primarily of refined sugar. The top three buyers — North Korea, Hong Kong, and Mongolia — together account for over 60% of total export volume. Annual exports to the United States range from 4,500 to 5,000 MT, consisting mainly of rock sugar for Chinese and Asian-American communities.
For a deeper breakdown beyond USDA macro estimates, our specialized China sugar import report covers audited monthly trade flows, key provincial refiners, and landing CIF price drivers.
V. Syrups and Blended Powder Imports: Sharp Decline, Sources Diversify
China imported 1.87 MMT of syrups and blended powder products in MY 2024/25, down 14% year-on-year, equivalent to approximately 1.5 MMT of raw sugar. In the first five months of MY 2025/26 (October through February), imports totaled 605,000 MT, down 32% year-on-year. At the current pace, full-year imports could reach approximately 1.25 MMT, equivalent to roughly 1.0 MMT of raw sugar. Thailand, Laos, Malaysia, and Vietnam remain the primary suppliers.
Effective December 10, 2024, China suspended import licenses for 74 Thai syrup and blended powder producers due to sanitary violations, including microbial contamination. This restriction remains in force. Prior to this measure, Thailand had accounted for over 85% of China’s syrup and blended powder imports.
VI. Stocks and Other Sweeteners
China’s sugar ending stocks for MY 2026/27 are projected at 4.02 MMT, a significant increase from the estimated 2.78 MMT in MY 2025/26. Industry reports indicate that Guangxi’s industrial sugar inventories reached 4.342 MMT as of end-March 2026, up 45.6% year-on-year.
Regarding other sweeteners, China’s starch sugar production in calendar year 2025 is estimated at 20 MMT, down 1 MMT from 2024, as profit margins narrowed. Production in 2026 is expected to remain flat amid persistently weak demand from the beverage, food, and confectionery sectors. For saccharin, China’s annual production quota is set at 19,000 MT — 3,200 MT allocated for domestic sales and 15,800 MT for export.
VII. Outlook
The report notes that cane sugar accounts for over 85% of China’s total sugar production, and industry sources expect output to stabilize in the range of 10–12 MMT per year. As Chinese demand and imports grow, domestic sugar prices are expected to increasingly track global market trends. China’s per capita sugar consumption is estimated at 11–12 kg, well below the global average of over 20 kg. As the economy expands and dietary patterns diversify — particularly with rising consumption in second- and third-tier cities and developing urban areas — per capita consumption is expected to grow.
| Sugar, Centrifugal | 2024/2025 | 2025/2026 | 2026/2027 |
| Market Year Begins | Oct 2024 | Oct 2025 | Oct 2026 |
| Beginning Stocks (1,000 MT) |
1,383
|
1,643
|
2,783
|
| Beet Sugar Production (1,000 MT) |
1,500
|
1,500
|
1,400
|
| Cane Sugar Production (1,000 MT) |
9,660
|
11,100
|
11,300
|
| Total Sugar Production (1,000 MT) |
11,160
|
12,600
|
12,700
|
| Raw Imports (1,000 MT) |
4,248
|
4,150
|
4,150
|
| Refined Imp.(Raw Val) (1,000 MT) |
396
|
350
|
350
|
| Total Imports (1,000 MT) |
4,644
|
4,500
|
4,500
|
| Total Supply (1,000 MT) |
17,187
|
18,743
|
19,983
|
| Raw Exports (1,000 MT) |
3
|
3
|
3
|
| Refined Exp.(Raw Val) (1,000 MT) |
163
|
157
|
157
|
| Total Exports (1,000 MT) |
166
|
160
|
160
|
| Human Dom. Consumption (1,000 MT) |
15,378
|
15,800
|
15,800
|
| Other Disappearance (1,000 MT) |
0
|
0
|
0
|
| Total Use (1,000 MT) |
15,378
|
15,800
|
15,800
|
| Ending Stocks (1,000 MT) |
1,643
|
2,783
|
4,023
|
| Total Distribution (1,000 MT) |
17,187
|
18,743
|
19,983
|
Disclaimer: This article is a summary and analysis based on the USDA Foreign Agricultural Service (FAS) Sugar Annual Report (CH2026-0051). The data and forecasts provided are for informational purposes only and do not constitute investment advice. While we strive for accuracy, ynsugar.com is not responsible for any market decisions made based on this content.