Industrial Demand Takes the Lead, with Diverging Sub-Sectors
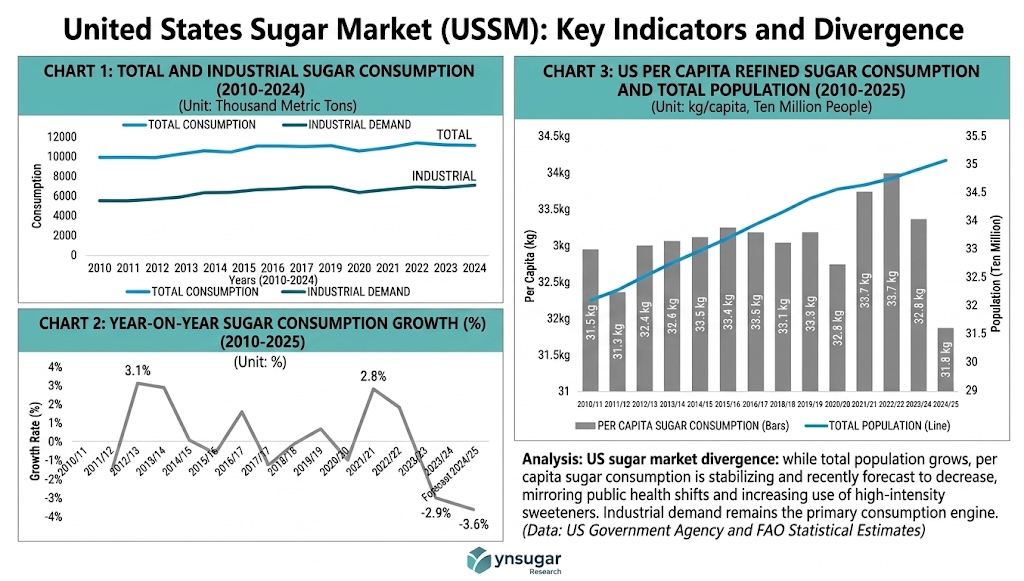
Between 2010 and 2024, U.S. sugar consumption followed a “rise–dip–rebound” trajectory. Sugar consumption in the United States has been on the rise in the past decade, with Americans consuming over 11 million metric tons of sugar since 2019/2020, up from about 10 million metric tons in 2009/2010.However, the post-2010 “reversal” was not a uniform recovery across the board. Instead, growth has been overwhelmingly driven by the industrial end-use segment, producing a pattern best described as “industrial-led growth with internal divergence.”
Industrial sugar deliveries have trended steadily upward, and their share of total consumption has gradually risen, mirroring the contour of total consumption. Within that broad uptrend, however, individual sub-sectors have moved in different directions, displaying a composite profile of stable demand in core staples, rapid growth in beverages, and synergistic expansion across multiple segments. Key factors contributing to this market’s size include the consistent demand for sugar in food and beverage manufacturing, particularly in the bakery, confectionery, and soft drink industries.The beverage industry, valued at over USD 230 billion in 2023, is a significant driver of sugar consumption, with soft drink production in the U.S. relying heavily on sugar as a core ingredient, while U.S. confectionery sales topped USD 45 billion in 2022.These dynamics together reflect both the upgrading of the U.S. food industry and shifting consumer preferences.
Pronounced Seasonality in Demand
U.S. sugar consumption exhibits a clear seasonal cycle. Based on quarterly data from 2010 to 2024, the third quarter consistently records the highest sugar consumption, while the first quarter is the lowest. This “summer-high, winter-low” rhythm is closely linked to the U.S. climate and consumption habits: hot summers boost demand for sugar-rich products such as soft drinks and ice cream, while winter demand is comparatively muted. The seasonal structure broadly tracks the production cycle of the food industry and shifting market needs. Notably, the U.S. sugar marketing year runs from October to September, which means that quarterly delivery patterns also reflect institutional reporting cycles in the trade.
Strong Regional Concentration with Structural Differences
The geographic structure of U.S. sugar consumption between 2010 and 2024 displays a distinct pattern: a **”North-Central and South dual-core” leadership, a stable West, and a contracting Mid-Atlantic**. Movements in the dominant regions are highly synchronized with shifts in the national total, making them the principal force pulling overall consumption upward through cyclical fluctuations.
This pattern reflects the geography of U.S. food manufacturing, regional economic conditions, and population migration. The USA market is dominated by states like Florida, Louisiana, and Texas, which are the largest sugarcane producers in the country. Florida’s dominance is due to its favorable climate, vast sugarcane farming areas, and proximity to major processing plants, while Louisiana benefits from its extensive infrastructure for sugar processing and a long history of sugarcane farming.On the beet-sugar side, the largest region for sugar beet production is the Red River Valley of western Minnesota and eastern North Dakota, where area planted increased consistently through the 1990s and into the 2000s and has accounted for the majority of total planted U.S. sugar beet acreage.The geographic concentration of processors and downstream food manufacturers naturally anchors regional sugar demand.
Per-Capita Consumption: Quantitative Profile and International Benchmarks
The United States has long been established as a global heavyweight in per-capita sweetener consumption. When accounting for total caloric sweeteners—a category that encompasses both refined sugar (sucrose) and high-fructose corn syrup (HFCS)—the U.S. intake is estimated at approximately 126.4 grams per person per day. This figure places the United States among the highest in the world, typically trailing only Mexico in global comparisons, and stands in stark contrast to international health guidelines which recommend significantly lower daily limits.
From the 2010/11 to 2024/25 marketing years, while the broader “sweetener basket” has faced scrutiny, U.S. annual consumption of refined beet and cane sugar has remained remarkably stable. According to FAO-based data, refined sugar consumption per capita reached 33.7 kg in 2021—a 2.84% increase over the previous year. Although this is down from the historical all-time high of 44.9 kg in 1972, the current plateau reflects a mature market where the displacement of HFCS has allowed refined sugar to maintain a solid, high-volume baseline in the American diet.
The 15-year increase in total U.S. sugar consumption has been propelled by the dual drivers of a generally rising per-capita intake and continuing population growth. Yet annual growth rates have been highly sensitive and volatile, with year-on-year swings far sharper than those of the global market as a whole. This “sawtooth” pattern signals that U.S. sugar demand reacts strongly to external shocks — economic cycles, raw-material price movements, and shifting public-health discourse.
Several recent USDA assessments illustrate this volatility. U.S. sugar deliveries for food and beverage use in 2024/25 (12.045 million STRV) and 2025/26 (11.960 million STRV) reflect a 3-year consecutivedecline trend in some categories, and the 2024/25 deliveries for human consumption were reduced to 12.045 million STRV based on the persistent slowdown in deliveries through May, with the weak delivery pace expected to continue into the next fiscal year, lowering the 2025/26 forecast for food use deliveries by 165,000 STRV to 11.960 million.Such adjustments reveal how quickly demand expectations can shift in response to economic and behavioral signals.
Health-driven dietary changes are also shaping the long-run picture. A peer-reviewed study of household purchases found that total sugar purchases decreased over the study period, both in absolute terms (−37.2 g/capita/day) and as a percentage of total calories purchased (−5.3 percentage points), while beverages’ contributions to sugar purchases decreased 8.1 percentage points. At the same time, sugar purchases declined for all sociodemographic groups, but disparities have persisted or widened, particularly among individuals who are non-Hispanic Black, low-income, and with lower educational attainment— a reminder that the headline trend masks substantial heterogeneity beneath the surface.
Implications
Taken together, the evidence shows that the U.S. sugar market is mature, structurally industrial, regionally concentrated, seasonally patterned, and behaviorally sensitive. Industrial demand — especially from beverages and confectionery — remains the primary engine, but it is increasingly buffeted by health awareness, regulatory pressures, and the rise of alternative sweeteners. Increasing awareness of obesity, diabetes, and cardiovascular issues is reducing demand in developed markets, and as a result, consumers are shifting toward low-GI, reduced-sugar, and natural sweetener alternatives like stevia and jaggery, impacting overall sugar consumption.For market participants, monitoring sub-sector divergence, regional production-consumption linkages, and the interplay between economic cycles and health-policy signals will be essential to understanding the next phase of U.S. sugar demand.
U.S. Sugar Industry Sounds Alarm, Urges Washington to Crack Down on Subsidized Imports
Disclaimer: This analysis is based on historical data from USDA, and peer-reviewed industry studies. Projections for the 2025/26 marketing year are subject to revision based on updated WASDE reports. The views expressed herein represent the ynsugar research team’s interpretation of market dynamics and do not constitute investment advice.