According to the latest customs data, China sugar imports 2026 witnessed a dramatic single-month contraction in April, dropping to a multi-year low…
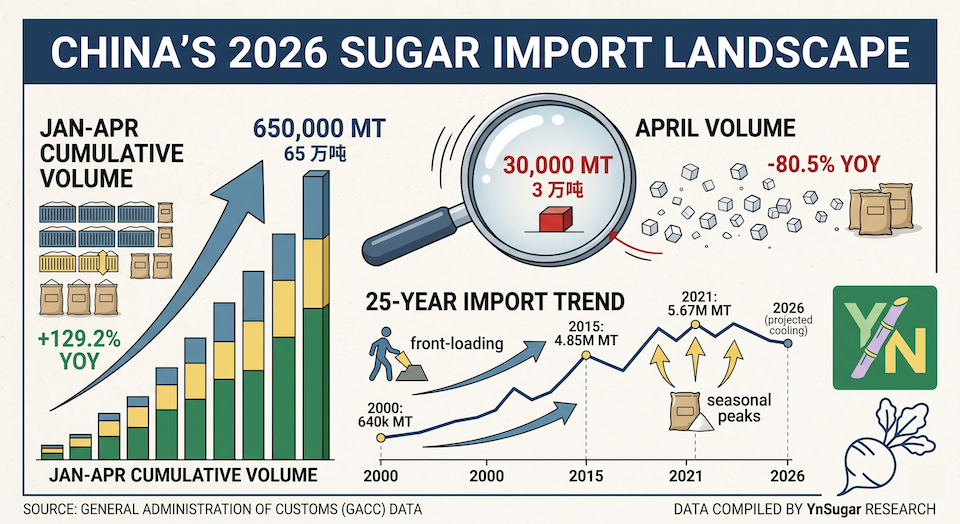
China’s sugar import volume dropped sharply in April 2026, with official customs data showing only 30,000 metric tons (MT) cleared during the month—representing an 80.5% year-on-year (YoY) decline.
While the cumulative January–April 2026 total reached 650,000 MT (still up 129.2% over the low base of the same period last year), the April figure alone signals a dramatic single-month contraction. This stark contrast underscores a heavily front-loaded import pattern in the first quarter of the year.
April 2026 Customs Data at a Glance
According to the latest commodity import statistics released by China’s General Administration of Customs (GACC), sugar (食糖) imports saw a steep deceleration in momentum. The breakdown of the data reveals:
-
April Import Volume: 30,000 MT (3 万吨), down 80.5% YoY
-
April Import Value: ¥90.82 million, down 80.9% YoY
-
Jan–Apr Cumulative Volume: 650,000 MT (65 万吨), up 129.2% YoY
-
Jan–Apr Cumulative Value: ¥1.905 billion, up 77.8% YoY
The divergence between the surging cumulative data and the sudden drop in April indicates that massive volumes were cleared in January and February, exhausting immediate import demand before the spring slowdown.
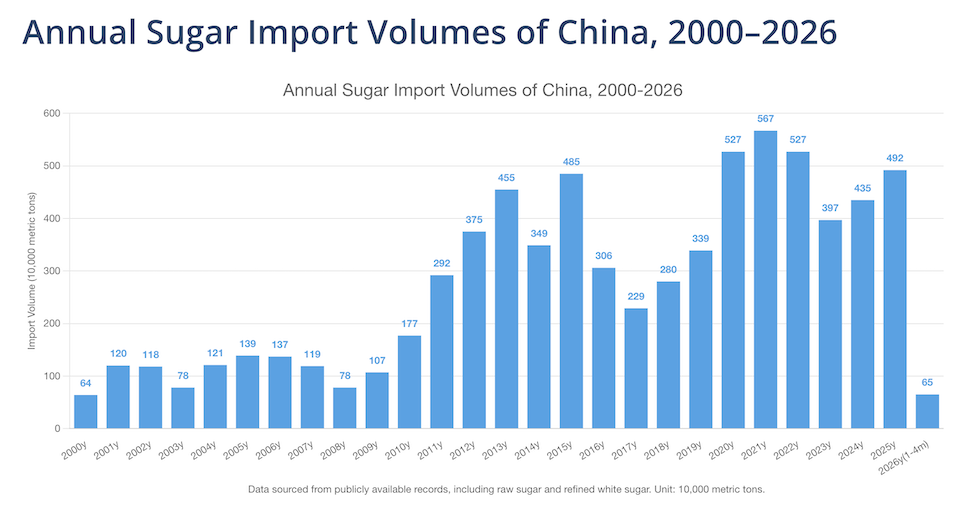
25-Year Import Trend: The Structural Shift
A longitudinal analysis of China’s annual sugar imports since 2000 highlights three distinct macroeconomic phases:
| Phase & Timeline | Annual Volume Range | Market Dynamics |
|
2000–2010
(Low-Volume Baseline) |
640,000 to 1.77 million MT | High domestic self-sufficiency; stable under-quota import reliance. |
|
2011–2015
(Rapid Expansion) |
2.92 million to 4.85 million MT | Consumption outpaced domestic production; expanding middle-class industrial demand. |
|
2016–2026
(Volatile High Plateau) |
2.29 million to 5.67 million MT | High volatility; peaked at 5.67 million MT in 2021, flanked by 5.27 million MT in both 2020 and 2022. |
China Historical Sugar Imports (Selected Peak/Trough Years in Million MT)
2000: 0.64
2015: 4.85
2021: 5.67 (All-time Record)
2023: 3.97
2024: 4.35
2025: 4.92
The 4.92 million MT recorded in 2025 demonstrated strong, continuing import reliance. However, the 2026 Jan–Apr cumulative total of 650,000 MT suggests that the full-year trajectory might cool down compared to last year, provided the current pacing holds through the second half.
Monthly Seasonality: A Deeply Cyclic Pattern
Historical monthly data from 2008 to 2026 confirms that China’s sugar imports follow a strict seasonal calendar:
-
The Peak (August–October): Inflows usually surge late in the third quarter when domestic sugar mill inventories are depleted right before the new domestic sugarcane crushing season kicks off in November.
-
The Trough (March–April): Fresh customs clearances routinely dry up as post-Lunar New Year demand softens and domestic mills operate at peak capacity.
April Sugar Import Comparison (Recent Years in MT)
2022: ██████████████████████████████ 420,000 MT
2023: █████ 70,000 MT
2024: ████ 50,000 MT
2025: ██████████ 134,900 MT
2026: ██ 30,000 MT
While a low April figure is expected due to seasonality, the 30,000 MT print is the lowest April reading in recent history. The intensity of this year’s drop implies that trade participants aggressively pulled forward their shipments into Q1 to capture specific arbitrage windows, leaving April volumes exceptionally thin.
YnSugar Analysis & Market Outlook
Several overlapping structural and cyclical drivers explain the current import trajectory:
-
Strong Domestic Crushing Season: China’s 2025/26 sugar production is wrapping up with strong yields, projected to reach between 12.80 million MT. This robust domestic supply has temporarily alleviated the pressure for immediate foreign sourcing.
-
Global Supply Buffer: Anticipated global surpluses for the 2025/26 marketing year—led by solid production out of Brazil (approx. 42 million MT) and India (35+ million MT)—have stabilized international raw sugar prices, removing the urgency for emergency speculative restocking.
-
Q1 Inventory Accumulation: Extensive bonded warehouse clearances and strong arrivals during January and February successfully absorbed immediate domestic supply deficits, neutralizing the need for fresh out-of-quota imports in April.
-
Stringent Regulatory Oversight: China’s Tariff-Rate Quota (TRQ) management continues to smoothly regulate timing. Concurrently, increased customs vigilance regarding the imports of liquid sugar, sugar syrups, and premixed powders has successfully contained irregular inflows.
Data Sources: * General Administration of Customs of the People’s Republic of China (GACC), April 2026 Monthly Commodity Trade Statistics.
-
YnSugar Historical Database (2000–2026).
Disclaimer: The analysis, data, and market outlook presented in this article are for informational and educational purposes only. While derived from official customs statistics and reputable industry sources, they do not constitute financial, investment, or commercial advice. YnSugar accepts no liability for any trading or investment decisions made based on the information provided herein. Market participants should conduct independent verification before executing trades.