Across most sugar-producing nations, the standard playbook for strengthening supply security in the Japan sugar industry is straightforward: raise yields per hectare, lift extraction rates, and drive down unit production costs…
Analysis by the ynsugar research team · Data compiled from Japan’s Ministry of Agriculture, Forestry and Fisheries (MAFF) and the Agriculture & Livestock Industries Corporation (ALIC) · Marketing year 2025/26 figures are official forecasts
The short version
Across most sugar-producing nations, the standard playbook for strengthening supply security is straightforward: raise yields per hectare, lift extraction rates, and drive down unit production costs.
Japan is the exception that tests the rule.
Japan does not face an immediate physical sugar shortage. What it faces is a slow-motion structural challenge: how to maintain a resilient domestic sugar ecosystem in a market where national consumption is in secular decline, while raw sugar imports permanently supply nearly two-thirds of total demand.
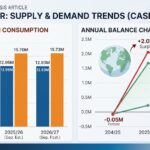
For the 2025/26 marketing year (MY), total Japanese sugar demand is forecast at 1.791 million metric tons. Domestic production accounts for just 648,000 tons (~36.2%), leaving 1.144 million tons to be covered by imports and stock drawdowns.
That structural gap is not new. The critical question for trade risk analysts is what happens to systemic supply resilience when a small, geographically concentrated domestic sector is continuously optimized for maximum unit efficiency.
Demand has been falling for three decades
Japanese sugar consumption peaked above 2.6 million metric tons per year in the early 1990s. It has since declined steadily below 1.8 million tons.
This is not a temporary cyclical contraction; it is driven by three irreversible structural trends:
-
Demographics: A shrinking and aging population consumes fewer caloric sweeteners across all food categories.
-
Health and dietary shifts: Sustained policy, public health campaigns, and consumer preferences favoring low-sugar formulations.
-
Alternative sweeteners: Isomerized sugars—principally High Fructose Corn Syrup (HFCS) and starch-derived syrups—have captured durable market share, particularly in beverages.
Per-capita refined sugar consumption reflects this long-term reality: dropping from 22.3 kg in 1980 to a projected 14.6 kg in MY 2025/26.
Most Japanese sugar never enters a home kitchen
A common misconception in market coverage is focusing on retail consumer behavior. According to MAFF sector breakdowns, household consumption accounts for only ~8.7% of total sugar demand.
The remaining 91.3% is industrial and commercial B2B demand, distributed across:
-
Confectionery, baking, and frozen desserts
-
Soft drinks, dairy, and RTD alcoholic beverages
-
Institutional food service and retail private-label manufacturing
Market Implication: Japanese sugar demand is not driven by household grocery decisions. It is dictated by institutional reformulations inside corporate food and beverage manufacturers. A single major product reformulation across a corporate beverage portfolio can impact national demand more than a year of retail consumer shifts.
Three parallel systems, one policy framework
Japan’s sugar sector is not a single integrated market. It consists of three distinct supply channels operating under one national regulatory and price-adjustment framework.
                  ┌─────────────────────────────────────────┐
                  │       Total Japanese Demand (1.791M t)  │
                  └────────────────────┬────────────────────┘
                                       │
         ┌─────────────────────────────┼─────────────────────────────┐
         ▼                             ▼                             ▼
┌──────────────────┐          ┌──────────────────┐          ┌──────────────────┐
│  Hokkaido Beet   │          │   Okinawa Cane   │          │  Coastal Refinement│
│  (~380k-450k t)  │          │  (~150k-200k t)  │          │ (~1.05M t Imports)│
└────────┬─────────┘          └────────┬─────────┘          └────────┬─────────┘
         │                             │                             │
         └─────────────────────────────┴─────────────────────────────┘
                                       │
                                       ▼
                  ┌─────────────────────────────────────────┐
                  │   Price Adjustment Levy Mechanism       │
                  │   (Import levies subsidize domestic)    │
                  └─────────────────────────────────────────┘
1. Beet sugar in Hokkaido
Sugar beet represents the largest component of domestic output and is grown exclusively in Hokkaido. Beet is deeply integrated into local arable crop rotation cycles.
Harvesting and factory operations must run in a tightly synchronized autumn campaign. Processing plants require a stable, high-volume throughput to absorb significant fixed operational costs. Rotation planning, farm logistics, and factory capacity are strictly locked together.
2. Island cane sugar in the Nansei Chain
Sugarcane is cultivated across Okinawa and the Kagoshima island chain (Nansei Islands). These remote regions face limited alternative crop viability, extreme typhoon risks, and small, fragmented farm plots.
Cane is the economic anchor of the southern island agricultural economy. Its operational bottlenecks are logistical: island shipping, weather exposure, and long transport radii to processing hubs.
3. Coastal refiners and raw sugar imports
Coastal refineries process imported raw sugar to supply major urban population centers.
Import origin concentration is extreme. Out of an estimated 1.0728 million tons of imported raw cane sugar in 2025, approximately 1.0535 million tons (98.2%) is sourced from Australia.
Structural Linkage: Under Japan’s Sugar Price Adjustment Act, statutory levies assessed on raw sugar imports fund support payments for domestic beet and cane growers. Imported and domestic sugar do not operate in isolated silos; they are financial and operational counterweights inside a single regulated national balance.
Key industry players
Processing and refining capacity is distributed across specialized beet processors, island cane mills, and coastal refining consolidators:
| Company Name | Core Operational Focus | Market Role |
| Nippon Beet Sugar Manufacturing (Nitten) | Domestic Beet Sugar Processing | Key domestic processor operating primary plants in Hokkaido. |
| Hokkaido Sugar Co., Ltd. | Beet Processing & Distribution | Specialized processor tied directly to Hokkaido agricultural cooperatives. |
| DM Mitsui Sugar Co., Ltd. | Raw Sugar Refining & Value-Added | Market leader formed via consolidation; operates coastal refineries. |
| Wellneo Sugar Co., Ltd. | Coastal Refining & Functional Ingredients | Major refiner created through the merger of Nissin Sugar and Itochu Sugar. |
| Daito Sugar (Daito Seito) | Specialty & Industrial Sugars | Focuses on specialty liquid sugars, raw sugars, and customized B2B ingredients. |
The structural trap: Why domestic supply cannot scale down
Total sugar demand in Japan dropped from 1.957 million tons in MY 2016/17 to 1.809 million tons in MY 2024/25, with 1.791 million tons forecast for MY 2025/26.
In a standard commodity market, declining demand triggers a proportional reduction in domestic production capacity. In Japan, domestic capacity cannot be easily downscaled without breaking the system:
-
Reducing beet acreage breaks necessary rotation cycles for potato, wheat, and legume production across Hokkaido.
-
Cutting raw material volume lowers factory capacity utilization, driving up fixed processing costs per ton.
-
Closing a processing plant permanently destroys regional harvesting and transport infrastructure that cannot be economically rebuilt.
The policy challenge is not deciding how much domestic capacity to cut, but rather how to maintain operational viability for growers and mills in a shrinking market.
The efficiency paradox: Optimized yet fragile
To survive, domestic processing chains have optimized relentlessly: raising extraction rates, consolidating mill operations, and cutting unit overhead.
In average crop years, this maximizes efficiency. However, as buffer acreage and regional processing redundancies are eliminated, the system loses its shock absorbers.
  [ Cost Minimization & Mill Consolidation ]
                      │
                      ▼
  [ Higher Per-Ton Efficiency in Normal Years ]
                      │
                      ▼
  [ Loss of Redundant Capacity & Buffer Acreage ]
                      │
                      ▼
  [ Heightened Systemic Vulnerability to Weather & Crop Shocks ]
This dynamic creates the efficiency paradox: the industry becomes more cost-effective per ton, yet increasingly fragile to external disruptions.
-
Hokkaido’s concentration risk: The entire beet sector relies on a single geographic region and a narrow autumn processing campaign. A localized weather event or plant disease outbreak directly impacts over 60% of domestic production.
-
Island cane vulnerability: Southern cane yields fluctuate heavily due to typhoon frequency, rainfall variability, and maritime transport disruptions.
Domestic Supply Volatility (MY 2016/17 – MY 2025/26)
Official figures illustrate this operational volatility over the past decade:
| Marketing Year (Oct–Sep) | Domestic Production (10,000 MT) | Total Demand (10,000 MT) | Domestic Share (%) |
| 2016/17 | 68.8 | 195.7 | 35.2% |
| 2017/18 | 79.4 | 192.1 | 41.3% |
| 2018/19 | 74.5 | 189.5 | 39.3% |
| 2019/20 | 78.8 | 177.9 | 44.3% |
| 2020/21 | 78.3 | 176.9 | 44.3% |
| 2021/22 | 79.2 | 180.3 | 43.9% |
| 2022/23 | 70.2 | 180.4 | 38.9% |
| 2023/24 | 58.4 | 180.0 | 32.4% |
| 2024/25 | 69.4 | 180.9 | 38.4% |
| 2025/26 (f) | 64.8 | 179.1 | 36.2% |
Data Source: MAFF / ALIC. Note: Tonnages represent refined sugar equivalent.
Domestic production swung by more than 210,000 metric tons between MY 2017/18 (794,000 t) and MY 2023/24 (584,000 t). Because consumption remains steady around 1.8 million tons, every domestic yield failure must be absorbed by additional raw imports or reserve stock drawdowns—further heightening reliance on external supply chains.
Key takeaways for traders and procurement managers
-
Monitor Hokkaido climate over national demand shifts: Domestic demand changes gradually, but domestic supply shifts abruptly. The primary volatility variable sits in Hokkaido weather patterns.
-
Import concentration remains a key exposure: With ~98% of imported raw cane sugar arriving from Australia, any freight, climate, or trade policy bottleneck on the Australia–Japan trade route exposes refiners to single-origin supply shocks.
-
Industrial reformulation is the primary demand driver: Over 91% of sugar is consumed in B2B channels. Commodity analysts should track institutional food manufacturing trends rather than retail consumer surveys.
-
Efficiency is not resilience: Industrial consolidation has optimized cost structures but removed the systemic buffer capacity required to absorb severe climate or yield shocks.
Methodology, Sources, and Limitations
-
Data Sources: Compiled from statistics published by Japan’s Ministry of Agriculture, Forestry and Fisheries (MAFF) and the Agriculture & Livestock Industries Corporation (ALIC).
-
Timeframe: Figures refer to Japanese Sugar Marketing Years (October 1 to September 30). Tonnages are metric tons (refined basis). MY 2025/26 figures reflect official mid-term forecasts.
-
Import Scope: The 98.2% Australian import share specifically references raw cane sugar imports (HS Code 1701.14), excluding refined sugars, specialty syrups, and HFCS starch imports.
Disclaimer:
This analysis is prepared by the ynsugar research team for market intelligence and educational purposes only. It does not constitute commercial procurement, financial, or investment advice. Data is compiled from official government sources (MAFF/ALIC); however, market projections are subject to revision based on seasonal harvest reports and official policy adjustments. Neither ynsugar nor its editors assume liability for commercial or trading decisions made based on the content of this publication.