Official trade data reveals that Brazil sugar exports reached 12.27 million metric tons in H1 2026, with top buyer destinations showing significant market diversification across South Asia, Africa, and East Asia…
Executive Summary
Brazil, the world’s largest sugar producer and exporter—typically producing over 40 million metric tons (MT) and exporting more than 30 million MT annually—demonstrated a highly diversified export profile in the first half of 2026. Official government trade data released by Brazil’s Foreign Trade Secretariat (Secex) on July 20 indicates that Brazil exported 12.27 million MT of sugar between January and June 2026.
A key characteristic of Brazil sugar exports during H1 2026 was the geographical dispersion of buyers. Rather than relying heavily on a single destination, demand was spread across South Asia, West Asia, North Africa, West Africa, and East Asia. Notably, China was not the top buyer, ranking 6th overall despite a massive surge in shipments in June.
H1 2026 Top Destinations for Brazilian Sugar
The top six buyers accounted for 5.71 million MT, representing 46.54% of total shipments in H1 2026.
| Destination Country | H1 2026 Export Volume (MT) | Share of Total Exports (%) | Region |
| India | 1,081,216 | 8.81% | South Asia |
| Saudi Arabia | 1,019,674 | 8.31% | West Asia |
| Bangladesh | 976,101 | 7.95% | South Asia |
| Algeria | 965,005 | 7.86% | North Africa |
| Nigeria | 847,501 | 6.91% | West Africa |
| China | 822,063 | 6.70% | East Asia |
| Top 6 Total | 5,711,560 | 46.54% | — |
| Global Total | 12,273,442 | 100.00% | Global |
India and Saudi Arabia Lead as Million-Ton Buyers
India and Saudi Arabia were the only two destinations to cross the 1-million-ton threshold in H1 2026, collectively receiving over 2.10 million MT (17.12% of Brazil’s total exports).
-
India (1.08 Million MT): Facing domestic sugar price increases, New Delhi temporarily lifted export restrictions and turned to Brazilian imports to supplement local supplies. To curb hoarding, India also implemented strict stock holding limits (capped at 400 MT for domestic traders).
-
Saudi Arabia (1.02 Million MT): Maintained consistent buying momentum, highlighting its role as a premier refining and distribution hub in West Asia.
For global market participants, these concentration points mean that monthly fluctuations in Brazilian exports often reflect procurement timing in a small number of major markets rather than immediate shifts in global end-user consumption.
China’s H1 Buying Surge Concentrated in June
China imported 822,063 MT of Brazilian sugar in H1 2026, making up 6.70% of Brazil’s total exports. However, physical shipments were heavily backloaded into the end of the second quarter.
            Brazil Sugar Exports to China (H1 2026)
┌───────────┬───────────────────┬─────────────────────────────────┐
│ Month     │ Volume (MT)       │ % of H1 Total to China          │
├───────────┼───────────────────┼─────────────────────────────────┤
│ January   │ 108               │ 0.01%                           │
│ February  │ 76,495            │ 9.31%                           │
│ March     │ 40,036            │ 4.87%                           │
│ April     │ 39,775            │ 4.84%                           │
│ May       │ 117,936           │ 14.35%                          │
│ June      │ 547,713           │ 66.63%                          │
├───────────┼───────────────────┼─────────────────────────────────┤
│ Total     │ 822,063           │ 100.00%                         │
└───────────┴───────────────────┴─────────────────────────────────┘
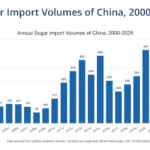
In June alone, shipments to China reached 547,713 MT, representing 66.63% of the entire six-month total. According to General Administration of Customs of China (GACC) data, China’s total sugar imports reached 1.14 million MT in H1 2026 (up 9.6% year-on-year). Based on these statistics, Brazilian raw sugar accounted for 72.11% of China’s total sugar imports in the first half of the year.
📊 Explore In-Depth Import Trends: For comprehensive historical data, tariff structures, and real-time updates on Chinese raw sugar trade, read our complete guide on China Sugar Import Report & Analysis.
Global Market Diversification and Price Realignment
While the top six buyers absorbed 5.71 million MT, 53.46% (6.56 million MT) of Brazil’s sugar exports went to a wide variety of smaller destinations across Africa, Asia, and the Americas.
Despite maintaining near-record export volumes, Brazilian exporters saw lower total revenues due to declining global market prices in 2026.
Year-over-Year Comparison (H1 2025 vs. H1 2026)
-
Export Volume: Declined 4.58% YoY from 12.86 million MT to 12.27 million MT.
-
Export Revenue: Fell 25.19% YoY from $5.90 billion to $4.42 billion.
-
Average Export Price: Decreased 21.60% YoY from $458.80/MT to $359.69/MT.
Monthly Breakdown of Brazil Sugar Exports (2026)
| Month | Volume (Million MT) | Value (USD Million) | Avg Price (USD / MT) |
| January | 2.00 | $736 | $368.86 |
| February | 2.20 | $803 | $365.47 |
| March | 1.81 | $652 | $360.78 |
| April | 1.18 | $439 | $371.37 |
| May | 1.97 | $692 | $352.19 |
| June | 3.13 | $1,092 | $349.44 |
Conclusion
Brazil’s H1 2026 export data highlights both high geographic diversification and price adjustment. While total volumes contracted slightly by 4.6%, revenue fell sharply due to softening international raw sugar prices. Looking ahead into H2 2026, market liquidity will depend heavily on whether buying momentum from secondary destinations continues to offset potential procurement adjustments from major importers like China and India.
Disclaimer: Market data and trade statistics presented in this report are sourced from Brazil Secex and China Customs (GACC). This analysis is provided for informational purposes only and does not constitute trading, investment, or commercial advice. ynsugar assumes no liability for trading decisions based on this data.