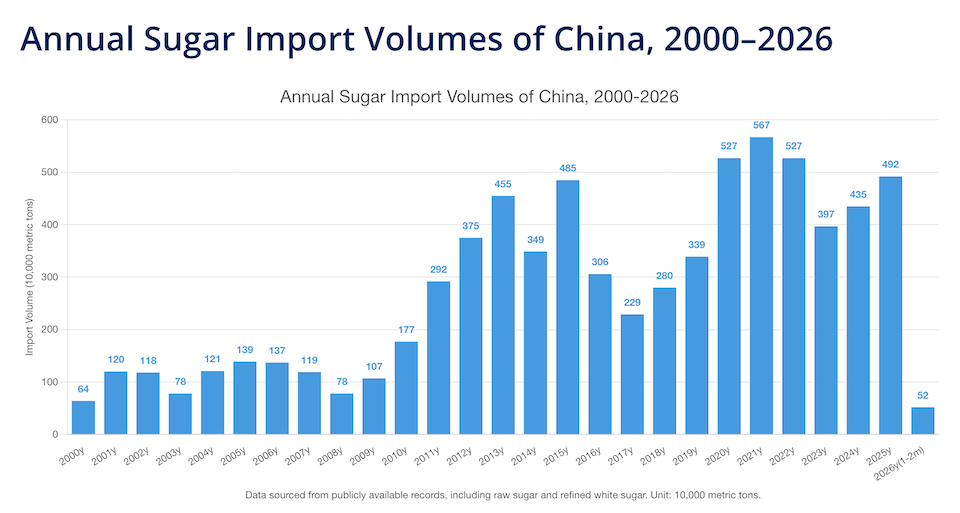
China is the world’s second-largest sugar consumer. Sugar is not only a daily staple for Chinese households but also a fundamental raw material for the food and beverage, pharmaceutical, and chemical industries. As living standards have risen, so has demand — yet domestic production remains highly vulnerable to extreme weather events and constraints on planted acreage. The result is a persistent structural deficit: under normal conditions, roughly one-third of China’s sugar demand must be met through imports, typically around four million metric tons per year and exceeding five million tons during peak periods.
This makes China one of the world’s top two sugar importers — and it is overwhelmingly dependent on a single source. In recent years, over 80% of China’s imported sugar has come from Brazil, creating a concentrated supply dependency that carries significant implications for price stability and food security.
Brazil: The World’s Sugar Powerhouse
Brazil is the global leader in sugarcane production, sugar output, and sugar exports. In a typical crushing season, the country processes around 700 million tons of sugarcane, producing over 40 million tons of sugar and exporting more than 30 million tons. No other country comes close to matching this scale.
Yet Brazil’s sugar industry operates with a unique structural feature that sets it apart from every other producer: sugarcane is not only used to make sugar — it is also the primary feedstock for Brazil’s massive bioethanol sector, making the country the world’s largest producer of sugarcane-based biofuel ethanol.
The Sugar-Ethanol Ratio: A Pivotal Variable
The allocation of sugarcane between sugar and ethanol production — commonly referred to as the “sugar-ethanol ratio” — is the single most important lever governing Brazil’s sugar output. Producers continuously compare sugar prices against ethanol prices (converted to a sugar-equivalent basis), calculating the spread to determine the profit-maximizing mix. Shifts in this ratio directly affect how much sugar Brazil produces and exports, with ripple effects on both domestic and international sugar prices — and, by extension, on global trade flows.
The numbers illustrate just how powerful this variable is. Each one-percentage-point increase in Brazil’s sugarcane-to-sugar allocation adds approximately 700,000 to 800,000 tons of sugar output. With cane production held constant, a ten-percentage-point shift can swing global supply by seven to eight million tons — a massive variable in a market where total global trade volumes are measured in the tens of millions of tons.
The math is striking:
- Every 1 percentage point increase in the sugar-production share adds roughly 700,000–800,000 tons of sugar output.
- A 10 percentage point shift—with cane volumes held constant—translates into 7–8 million tons of additional sugar on the global market.
Transmission to China’s Market
The connection between Brazil’s production decisions and China’s sugar market operates through two reinforcing channels. First, international sugar prices — largely shaped by Brazilian output — transmit directly into China via futures markets. Second, changes in Brazil’s export volumes alter the physical availability and cost of sugar flowing into China, particularly for imports above China’s tariff-rate quota (TRQ).
The mechanism works as follows: when Brazilian output rises, international sugar prices tend to fall. Because international prices typically decline more sharply than domestic Chinese prices in such scenarios, the price spread between the two markets widens. This increases the profit margin on imports, incentivizing traders to bring in more sugar, which in turn shifts China’s domestic supply-demand balance and puts downward pressure on local prices.
The Role of Trade Policy
China’s import policy framework adds another layer of complexity. Since its accession to the WTO, China has maintained a TRQ system for sugar: the in-quota tariff is approximately 15%, the over-quota tariff is around 50%, and the annual quota stands at 1.945 million tons. Imports within the quota are profitable under most market conditions, so the real focus for market participants is on the economics of over-quota imports and the policy signals surrounding them.
China’s Sugar Market Outlook: Steady Growth Expected in 2025/26
Beyond tariffs, China’s actual import volumes are also shaped by logistics, shipping costs, freight rates, and currency exchange rate fluctuations — all of which can meaningfully shift the landed cost of imported sugar and, with it, trade flow dynamics.
Since joining the WTO, China has operated a tariff-rate quota system for sugar:
- In-quota tariff: ~15%
- Out-of-quota tariff: ~50%
- Annual quota: 1.945 million tons
In-quota imports are profitable under most market conditions, so market attention naturally focuses on out-of-quota import margins and the policies governing them. These out-of-quota flows are where Brazilian production decisions hit hardest.
The Bigger Picture
In essence, a production decision made by Brazilian millers — weighing sugar against ethanol — can cascade through global commodity markets, reshape trade flows across the Atlantic and Pacific, and ultimately influence the price Chinese consumers and manufacturers pay for sugar. For anyone seeking to understand global sugar markets, the Brazil-China axis, and the sugar-ethanol ratio at its heart, is an indispensable piece of the puzzle.
Disclaimer: This report is synthesized from current market dynamics, historical trade patterns, and data sourced from publicly available official records. It is intended for industrial analysis and informational purposes only and does not constitute trading advice or financial forecasting.