April 10, 2026
Key Takeaways
- NY raw sugar (SBK26) fell 0.11 cents (-1.15%) to settle at 13.76 c/lb, the lowest close in five weeks.
- London white sugar (SWK26) dropped $1.30 to $413.80/ton, a four-week low.
- India confirmed no plans to restrict sugar exports this year, reinforcing bearish supply sentiment.
- Brazil’s Center-South region enters the 2026/27 crush season with strong production expectations.
- Strait of Hormuz disruptions have reduced global sugar trade flows by an estimated 6%, adding a layer of geopolitical risk.
Market Recap
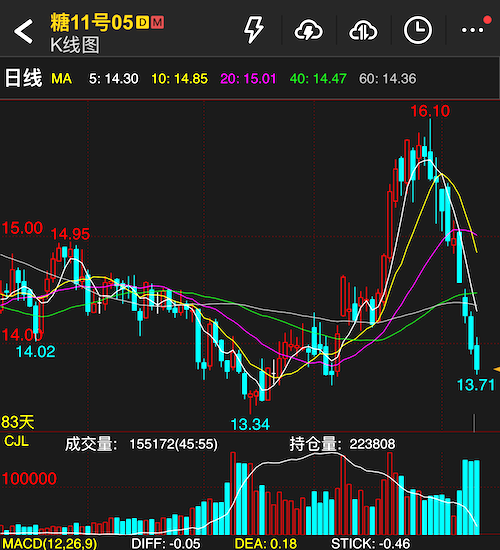 Sugar futures extended their week-long selloff on Friday, with the May New York #11 contract settling at 13.76 cents per pound — down 0.11 cents on the day and marking the fifth consecutive session of losses. The contract traded in a range of 13.71 to 14.06 cents intraday before sellers took control in the afternoon session.
Volume was robust at 155,172 lots, while open interest fell sharply by 42,195 contracts to 223,808 — a notable decline that suggests long liquidation rather than fresh short-selling was the primary driver of the move lower.
In London, May white sugar #5 declined $1.30 to settle at $413.80 per metric ton, hitting a four-week low in the process.
Fundamental Drivers
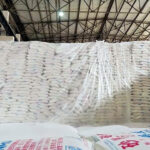
Abundant Global Supply Remains the Central Theme
The dominant bearish narrative continues to center on expectations of plentiful global sugar availability. Two key developments this week reinforced that view:
India keeps export doors open. On Tuesday, India’s Food Secretary confirmed that the government has no plans to impose a ban on sugar exports for the current marketing year. The statement directly addressed market speculation that New Delhi might redirect more sugarcane toward ethanol production amid crude oil supply uncertainties stemming from the Iran conflict. With India — the world’s second-largest sugar producer — maintaining its export posture, an additional layer of supply pressure remains firmly in place.
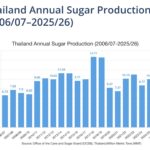
Brazil’s production engine gears up. The 2026/27 harvest in Brazil’s Center-South, the world’s largest sugar-producing region, is set to begin under favorable conditions. Forecasts point to another strong crop, keeping the global supply-demand balance tilted toward surplus and reinforcing the headwinds for price recovery.
Geopolitical Risk: Hormuz Strait Adds Volatility, Not Direction
The closure of the Strait of Hormuz — a consequence of the broader Middle East conflict — has introduced a meaningful logistical disruption. the blockage has reduced global sugar trade by approximately 6%, primarily by constraining shipping routes critical for the refined sugar supply chain.
However, while this disruption has injected volatility into the market, it has not been sufficient to reverse the prevailing bearish trend. For now, the macro supply picture outweighs the logistical friction.
Brazilian Producer Hedging: A Shifting Dynamic Worth Watching
One of the more nuanced developments comes from the producer side. According to StoneX, Brazilian mills used March’s price rally — partly fueled by geopolitical risk premiums — to aggressively accelerate their forward pricing (fixations) for the 2026/27 crop.
The percentage of sugar production hedged jumped from 41.8% to 59.5% in March alone, significantly narrowing a lag that had reached as much as 20 percentage points versus the prior year’s pace. As of late March, the gap stands at roughly 10 points compared to the 68.7% fixed by the same date in 2025.
Why does this matter?
The hedging backlog had effectively functioned as an informal ceiling on prices — every rally attracted a wave of producer selling that capped upside moves. With that overhang now substantially reduced, the market’s structural resistance to price increases has diminished.
“The market is now operating in a more balanced condition, with less resistance from the producer side to upward price movements,” said Nathalia Bruni, risk management consultant at StoneX.
In practical terms, this means that if a bullish catalyst were to emerge — whether from weather disruptions, further geopolitical escalation, or a shift in demand dynamics — the resulting price rally could be more sustained than what the market has been able to achieve in recent months.
Technical Analysis
The daily chart paints a decisively bearish picture in the near term:
Trend structure: Prices have fallen more than 14% from the March high of 16.10 c/lb. All major moving averages — MA5 (14.30), MA10 (14.85), MA20 (15.01), MA40 (14.47), and MA60 (14.36) — sit above the current price, forming a well-defined bearish alignment that will act as layered resistance on any recovery attempt.
Momentum: The MACD histogram remains negative and expanding (STICK: -0.46), with the DIFF line (-0.05) crossing below the DEA (0.18). There is no sign yet of bearish momentum exhaustion.
Key levels to watch:
| Level | Significance | |
|---|---|---|
| Support | 13.34 c/lb | Prior swing low — a breach opens the door to 13.00 |
| Support | 13.00 c/lb | Psychological round number |
| Resistance | 14.00–14.06 c/lb | Intraday high / psychological level |
| Resistance | 14.30 c/lb | 5-day moving average |
| Resistance | 14.47 c/lb | 40-day moving average |
Outlook & Trading Considerations
The path of least resistance remains to the downside. The confluence of ample global supply, India’s open export stance, and strong Brazilian production expectations provides little fundamental support for a sustained recovery. Meanwhile, the sharp drop in open interest suggests that existing longs are capitulating rather than defending positions.
However, traders should not become complacent on the short side. Two factors warrant attention:
-
Reduced producer hedging overhang — With Brazilian mills having caught up on a significant portion of their fixations, the “sell every rally” dynamic that defined Q1 has weakened. This changes the market’s response function to bullish shocks.
-
Hormuz Strait uncertainty — Any escalation in the Middle East that further disrupts trade routes could trigger a sharp short-covering rally, particularly given the current stretched short positioning.
Near-term bias: Bearish, with rallies toward 14.00–14.30 likely to encounter selling interest. A decisive break below 13.34 would confirm continuation toward the 13.00 handle. Conversely, stabilization around the 13.30–13.40 zone accompanied by a pickup in volume could signal a tactical buying opportunity for short-term traders looking to play a reversion move.
📈 Market Benchmark: Price movements at this level have historically triggered procurement adjustments — track how they feed into China’s sugar import decisions in our dedicated macro report.
Disclaimer: This commentary is for informational purposes only and does not constitute investment advice. Futures trading involves substantial risk of loss. Past performance is not indicative of future results.