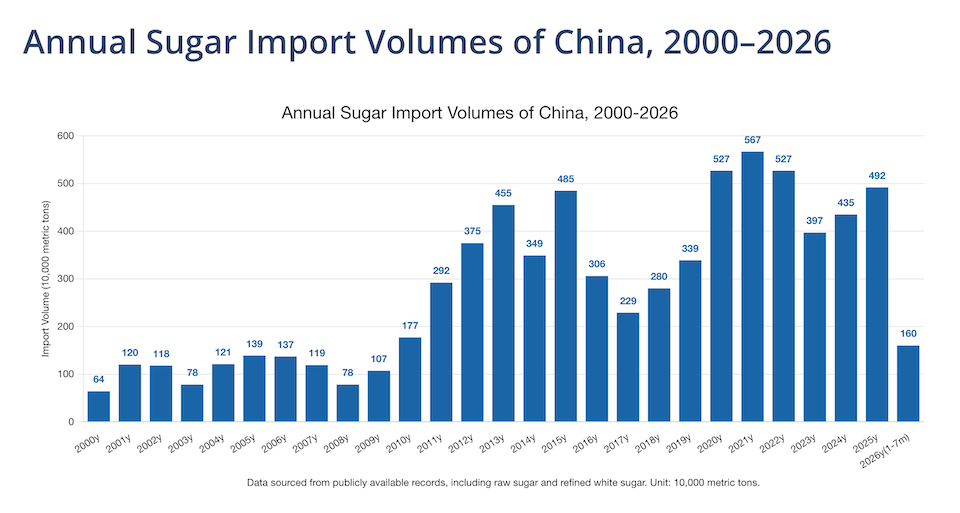
According to official customs data, China sugar imports reached 1.60 million metric tonnes in the first seven months of 2026, marking a pivotal shift in trade dynamics.
By: ynsugar Market Intelligence Team
Published: August 18, 2026
Data Source: General Administration of Customs of China (GACC); Processed & Analyzed by ynsugar.com
Executive Summary
-
Cumulative Volume (Jan–Jul 2026): 1.60 million metric tonnes (MMT), down 10.1% YoY.
-
Cumulative Value: RMB 4.403 billion, down 26.8% YoY, signaling a steep decline in landed procurement costs.
-
July Momentum: Monthly import volume surged to 470,000 tonnes (RMB 1.197 billion)—marking the highest single-month volume in 2026 so far.
-
Key Market Takeaway: The headline 10.1% year-on-year contraction masks a significant late-summer momentum shift and an aggressive drop in per-tonne import value. With seasonal port arrivals typically peaking between August and October, whether July’s 470kt is a temporary spike or the start of a sustained import wave will be pivotal for domestic Chinese sugar balance sheets.
1. Macro Context: Cumulative Imports Down 10.1%, but Baseline Effects Skew the Narrative
According to official customs data released on August 18, 2026, China’s sugar imports for the first seven months totaled 1.60 MMT. This equates to roughly one-third of the total 4.92 MMT imported in 2025.
| Year / Period | Total Annual Imports (MMT) | Jan–Jul Cumulative (MMT) | YoY Change (%) |
| 2020 | 5.27 | — | — |
| 2021 | 5.67 | — | — |
| 2022 | 5.27 | — | — |
| 2023 | 3.97 | — | — |
| 2024 | 4.35 | — | — |
| 2025 | 4.92 | ~1.78* | — |
| 2026 (Jan–Jul) | Projected tracking | 1.60 | -10.1% |
(Note: Calculated based on reported YoY customs growth rates.)
While high-level market commentary may interpret this as a broad import contraction, historical trade flow patterns caution against premature conclusions:
-
High Base Effect in July 2025: In July 2025, Chinese customs cleared approximately 750,000 tonnes—an exceptionally high monthly baseline.
-
First-Half Momentum: Excluding July, China’s H1 2026 (Jan–June) imports actually reached 1.13 MMT, outperforming the 1.03 MMT recorded in H1 2025.
-
Arrival Seasonality: Historically, the August–October window represents a primary arrival corridor for raw sugar shipments booked against international quota and out-of-quota parity windows.
2. Price Dynamics: Landed Value Drops Far Steeper Than Physical Volume
The most profound shift in the 2026 trade data lies on the price curve rather than the volume curve.
-
Cumulative Value Drop: -26.8% YoY (RMB 4.403 billion) vs. -10.1% YoY in volume.
-
July Single-Month Value Drop: -49.5% YoY (RMB 1.197 billion) vs. -37.5% YoY in volume.
-
Estimated Average Import Unit Price: Approximately RMB 2,750 per tonne (raw CIF/landed calculation prior to tariff and duty-paid structure adjustments), reflecting a decline of nearly 20% year-on-year.
This divergence underscores that Chinese refiners and state-authorized trading houses have benefited from more favorable raw sugar import price parity, substantially lowering the replacement cost of imported sweetening agents.
3. Supply Flow Trajectory: What July’s 470,000 Tonnes Signals
2026 Monthly Import Rhythm (Visual Path):
[Jan-Feb: Steady] ➔ [Mar-Apr: Trough/Slowdown] ➔ [May-Jun: Recovery] ➔ [July: Peak at 470kt (29% of 7-Month Total)]
July’s 470kt import volume accounts for nearly 29% of China’s cumulative 7-month total. This robust recovery confirms that physical port discharge activity gained significant traction following the late-spring dip.
4. ynsugar Intelligence Commentary & Outlook
Looking ahead into Q3 and early Q4 2026, the key focal point for international trade desks and domestic sugar refiners is not the backward-looking 10.1% deficit, but the pace of cargo discharge across August, September, and October.
-
Sustained Inflow Scenario (400–500kt/month): If Chinese ports maintain monthly arrivals above 450,000 tonnes through October, the cumulative deficit against 2025 will close rapidly, keeping domestic spot prices under pressure from ample supply.
-
Front-Loaded Surge Scenario: If July proves to be an isolated logistical clearance cluster, total 2026 imports will fall meaningfully short of the 4.92 MMT level seen in 2025, offering fundamental support to domestic spot pricing.
The market now looks to late-August customs manifests and shipping line lineups to verify whether processing margins will incentivize continued aggressive clearance.
Disclaimer: Data sourced from GACC and analyzed by the ynsugar intelligence team. This report is for general market reference only and does not constitute commercial, investment, or trading advice. Readers should verify details independently before making commercial decisions.