I. Market Overview & Import Data Breakdown
According to the latest data released by China’s General Administration of Customs, China sugar imports in May 2026 reached 210,000 tonnes, with a total import value of RMB 564.11 million. On a year-on-year basis, both volume and value declined significantly, with imports falling by 36.8% and import value dropping by 49.8%, indicating a simultaneous contraction in both quantity and price.
However, the cumulative picture tells a different story. From January to May 2026, China imported a total of 860,000 tonnes of sugar, amounting to RMB 2.469 billion. This represents a year-on-year increase of 39.9% in volume and 12.5% in value, highlighting a notable expansion in overall import scale during the first five months of the year.
II. Long-Term Trends & Seasonal Import Patterns
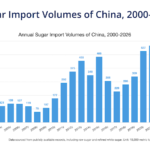
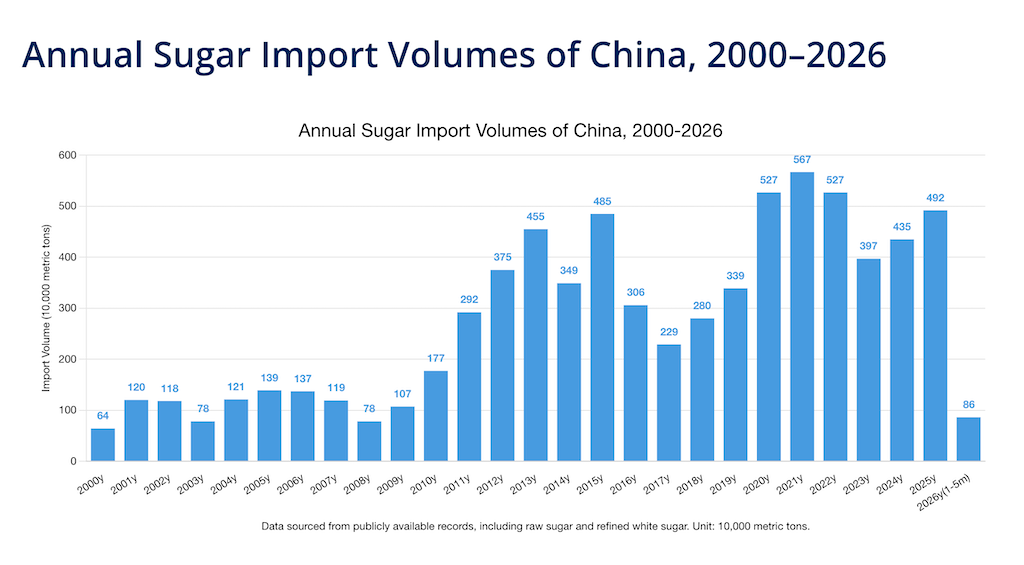
Looking at historical data, China’s sugar imports have shown a general upward trend since 2000. Imports stood at just 640,000 tonnes in 2000 and steadily increased over the following decade. Growth accelerated after surpassing 1 million tonnes in 2011, eventually reaching a record peak of 5.67 million tonnes in 2021. In recent years, imports have moderated, falling to 3.97 million tonnes in 2023 before recovering to 4.35 million tonnes in 2024 and further to 4.92 million tonnes in 2025.
China’s sugar imports also exhibit clear seasonality. Imports are typically subdued in the first half of the year—particularly from March to May—and begin to rise from July onward, with peak levels usually occurring between August and October. May import volumes have historically been highly volatile. While May 2026 imports are below the historical average for the same period, they represent a significant recovery compared to the unusually low troughs seen in 2023 and 2024.
III. Core Market Data Reference
| Year | May Import Volume (Tonnes) | Historical Context & Trend |
|---|---|---|
| 2020 | 300,000 | Mid-range volume period |
| 2021 | 180,000 | Year of record full-year peak (5.67M t) |
| 2022 | 260,000 | Steady seasonal import |
| 2023 | 40,000 | Severe import contraction |
| 2024 | 20,000 | Historical low for May |
| 2025 | 350,000 | Recent high for May volume |
| 2026 | 210,000 | Down 36.8% YoY; Jan-May cumulative up 39.9% |
IV. ynsugar Team Comments
ynsugar Outlook: The sharp year-on-year decline in May imports contrasts with the strong cumulative growth recorded earlier in the year, suggesting that import activity was heavily front-loaded in the first four months of 2026.
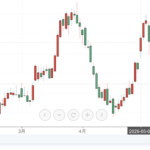
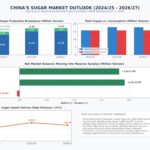
At present, China’s domestic sugar market is shifting toward a more balanced or even slightly oversupplied condition. Moving into the second half of the year, future import trends will likely be heavily influenced by three intersecting factors: international raw sugar margins (ICE No. 11), domestic crushing and logistics dynamics, and shifting import cost structures. ynsugar will continue to monitor developments in China’s sugar market and provide timely updates.
💡 Deep Dive into China’s Sugar Market:
For comprehensive historical datasets, policy analysis, and long-term trends of Chinese sugar trade, visit our comprehensive
China Sugar Import Report
pillar page.
Disclaimer: The data and market insights provided in this article are based on public customs records and are for informational purposes only. This content does not constitute trade, investment, or commercial advice. ynsugar.com assumes no liability for trading actions taken by readers based on this information.