Executive Trade Report by the YnSugar Analyst Team > China’s customs data reveals a sharp acceleration in sugar syrup and premix imports, with January–April 2026 volumes outpacing the full first half of 2025—while conventional refined sugar imports remain tightly constrained by quota restrictions.
1. Macro Context: The Accelerating Shift to Sugar Derivatives
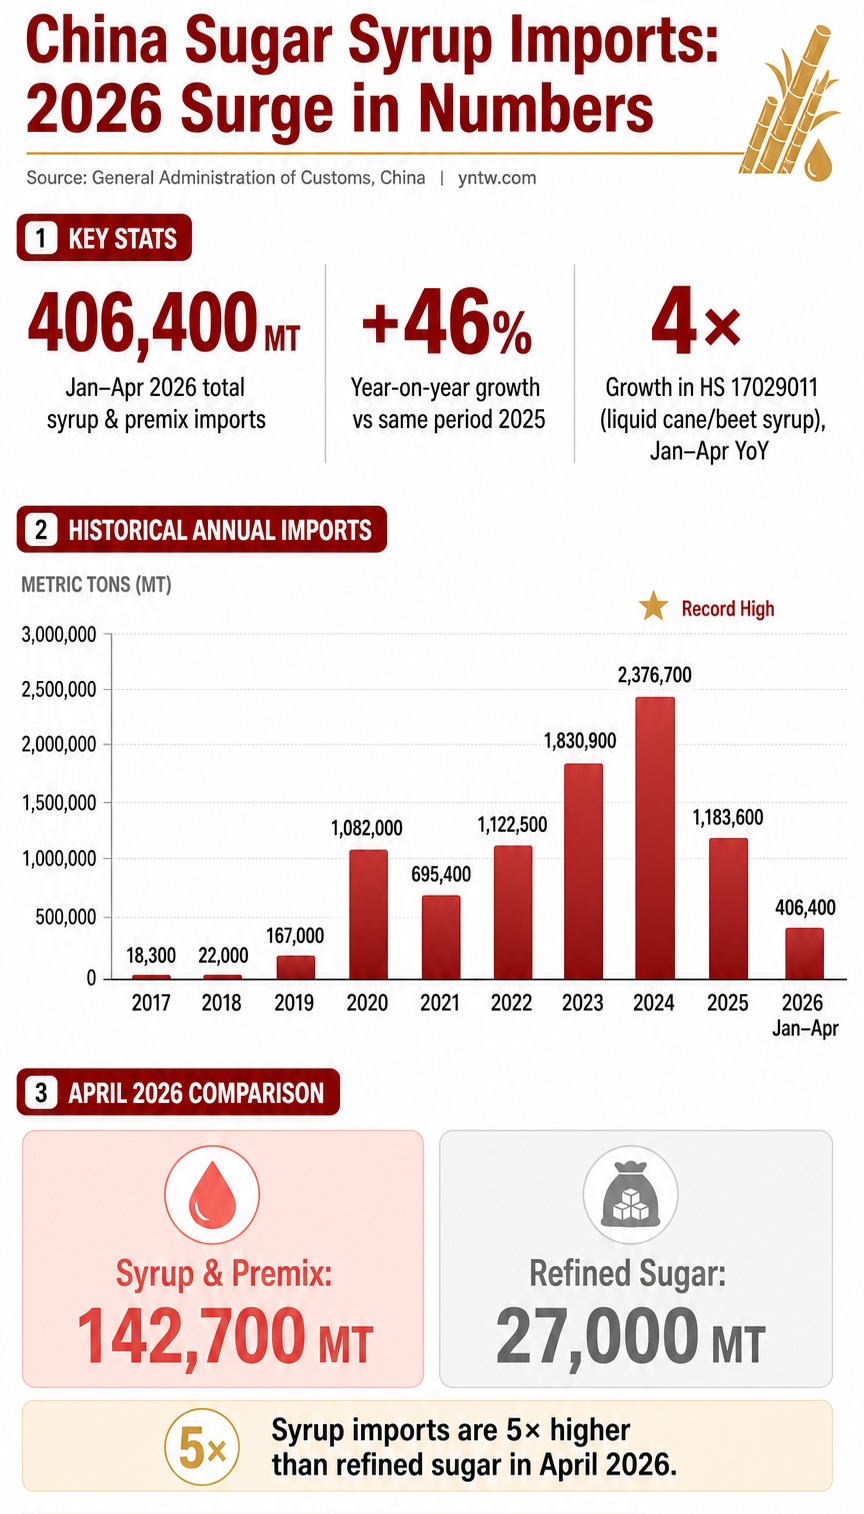
According to the latest statistics released by China’s General Administration of Customs (GAC), China imported 142,700 metric tons of sugar syrups and solid sugar mixtures in April 2026 alone, spanning five core Harmonized System (HS) code categories. This represents a substantial month-on-month increase of 16.11% compared to March 2026.
This surge underscores a permanent structural transformation within China’s sweetener supply chain. Importers are increasingly relying on processed sugar derivatives over conventional raw or refined sugar. Cumulatively, for the first four months of 2026, China’s total imports of sugar syrups and premix powders reached 406,400 metric tons—up from 278,300 metric tons during the same period in 2025. This absolute increase of 128,100 metric tons represents a massive 46.03% year-on-year surge, signalling a potent rebound in alternative carbohydrate inflows.
2. Logical Deduction: TRQ Evasion and the Post-Thailand Ban Trade Rerouting
The economic catalyst driving this 46% explosion is a classic story of tariff-rate quota (TRQ) optimization and subsequent geopolitical rerouting.
[China Conventional Sugar TRQ] ──> 50% Out-of-Quota Duty ──> High Importing Cost
[ASEAN-China FTA Loophole]     ──> 0% Duty via Syrup Codes  ──> Inflow Explosion
[December 2024 Thai Suspension] ──> Trade Flows Reroute     ──> Surge in Laos & Malaysia
The ASEAN-China FTA Loophole
Under the ASEAN–China Free Trade Agreement (FTA), duty fees are waived on exports of sugar syrups to China. Conventional sugar imports exceeding China’s strict TRQ system are penalized with a hefty 50% out-of-quota tariff. To bypass this barrier, commercial blenders and industrial users exploit tariff classifications by importing what is essentially dissolved sucrose under liquid syrup codes, effectively entering the Chinese mainland duty-free.
The Great Rerouting: Laos and Malaysia Fill the Vacuum
The primary velocity driver in 2026 is HS code 17029011 (aqueous solutions of cane or beet sugar, commercially known as “liquid sugar syrup”), which recorded a staggering fourfold increase year-on-year.
This specific classification’s growth is a direct consequence of regulatory enforcement: on December 10, 2024, Beijing suspended import permits for sugar syrup and premixed powder (HS 1702.90.0) from 74 manufacturers located in Thailand. With Thailand—previously the dominant exporter—effectively locked out of the market to defend domestic sugar millers, trade flows immediately adapted.
Data from April 2026 confirms that suppliers in Laos and Malaysia have stepped into the vacuum under the HS 17029011 classification. Inflow patterns indicate distinct geographic distribution:
-
Laos Inflows: Heavily registered across multiple mainland provincial borders, with substantial volumes cleared in Hebei, Zhejiang, Fujian, Shandong, Guangdong, and Yunnan.
-
Malaysia Inflows: Consolidating market share via strategic maritime ports, distributing shipments across Tianjin, Zhejiang, Fujian, Shandong, Hubei, Guangdong, and Sichuan provinces.
3. High-Density Commodity Data: Historical Import Trajectory (2017–2026)
To map the complete macro trajectory of this alternative sweetener trade, the YnSugar Research Team has aggregated and systematized ten years of customs data, highlighting the contrast between alternative syrup mixtures and tightly regulated conventional refined sugar.
Table 1: China Historical Imports of Sugar Syrups & Premixes vs. Conventional Refined Sugar
| Year / Period | Total Syrup & Premix Imports (MT) | Structural Market Context & Regulatory Catalysts | Monthly Refined/Raw Sugar Volume (MT) |
| 2017 | 18,300 MT | Negligible volumes; initial pilot testing of liquid sugar inflows. | Controlled via strict GAC TRQ allocations. |
| 2018 | 22,000 MT | Incipient commercial scale; early utilization of the ASEAN FTA loophole. | Stable domestic milling baseline. |
| 2019 | 167,000 MT | Accelerated adoption by industrial food and beverage processors. | Out-of-quota margins begin to tighten. |
| 2020 | 1,082,000 MT | First historic breach of the 1-million-ton threshold. | High international white sugar price volatility. |
| 2021 | 695,400 MT | Temporary contraction due to global maritime logistics bottlenecks. | Domestic milling sector calls for state intervention. |
| 2022 | 1,122,500 MT | Volumetric rebound; blending facilities expand capacity in Southeast Asia. | High out-of-quota import costs persist. |
| 2023 | 1,830,900 MT | Exponential growth; liquid sugar becomes a mainstream industrial feedstock. | Domestic spot prices reach multi-year highs. |
| 2024 | 2,376,700 MT | All-Time Record High; triggered the Dec 2024 suspension of 74 Thai mills. | Inflows heavily supressed by alternative syrup displacement. |
| 2025 | 1,183,600 MT | Sharp retreat following the enforcement of the Thai manufacturer ban. | Slight recovery in raw imports. |
| Current 2026 (Jan–Apr) | 406,400 MT | Current annualized pace indicates a major volumetric rebound to over 1.2M MT. | April Single Month: 27,000 MT (Less than 1/5 of single-month syrup inflows) |
4. Analyst Commentary: Supply Chain Vulnerability and Future Policy Outlook
Prepared by the YnSugar Analyst Team
The April 2026 data exposes a stark market anomaly: China imported a meager 27,000 metric tons of refined and raw sugar, which is less than one-fifth of the 142,700 metric tons recorded for alternative syrups and premixes in the exact same month. Cumulatively through April, conventional sugar imports stood at approximately 650,000 tons, meaning alternative liquid and solid mixtures now account for a massive 38% share of China’s total external sweetener inflows.
Structural Industry Risks
This data tells a compelling story of supply chain resilience but also extreme vulnerability. The immediate substitution of Thai origins with Laotian and Malaysian logistics pipelines demonstrates how swiftly cross-border commodity traders can adapt to trade barriers.
However, for domestic sugar refineries in Guangxi and Yunnan, the relentless flow of untariffed alternative sugars continues to depress local cash prices and squeeze processing margins.
Predictive Policy Outlook (2026–2027)
Global market participants must recognize that the current 46% surge places Beijing’s regulators in a difficult position. Having blocked Thai manufacturers under HS 1702.90.0 in late 2024, the subsequent volume explosion under HS 17029011 via Laos and Malaysia proves that tariff-code hopping is highly effective.
The YnSugar Research Team anticipates that if cumulative imports threaten to cross the 1.0-million-ton threshold by Q3 2026, the General Administration of Customs may expand its targetted enforcement. This could include tightening origin-verification audits (Rules of Origin) within the ASEAN framework or harmonizing liquid sugar classifications directly into the national TRQ architecture.
📊 Supply-Demand Equilibrium
Evaluate the Aggregate Picture: China’s Customs Data Breakdown for Sugar Imports
While alternative liquid sugars reroute traditional logistics, regular raw and white sugar imports remain the primary pillars of the national supply balance. Compare the volumes, trade channels, and regional landing margins instantly.
Data Source & Attributions: The chronological import statistics, HS classification metrics, and country-of-origin allocations cited in this briefing are derived from official trade documentation published by the General Administration of Customs of China (GAC). All historical datasets have been aggregated, cleaned, and cross-verified by the YnSugar Research Team for global market intelligence purposes.