Analysis based on preliminary data released by ynsugar. Figures are subject to revision upon the close of the crushing season.
Key Takeaways
- China’s total sugar output for the 2025/26 crushing season reached 12.966 million metric tons (MMT), according to preliminary data from ynsugar.
- This represents a year-over-year increase of 1.804 MMT, a 16.16% gain over the previous season.
- Guangxi remains the dominant producing region, accounting for roughly 59% of national output.
- The figures reflect domestically produced sugar only (including sugar milled from imported sugarcane) and exclude refined sugar processed from imported raw sugar.
Overview: China Sugar Production 2025/26 Approaches 13-Million-Ton Mark
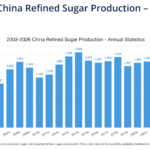
Preliminary statistics from ynsugar indicate that China produced 12.966 MMT of sugar during the 2025/26 crushing season—an increase of 1.804 MMT, or 16.16%, compared with the prior season. This marks the highest output level since the 2016/17 season, signaling that domestic sugar production has re-entered an expansionary phase after several years of volatility.
Historically, national output peaked at 14.84 MMT during the 2007/08 season before entering a period of cyclical fluctuation, bottoming out at 8.702 MMT in 2015/16. The current season’s robust growth pushes production back toward the upper end of its long-term range.
Regional Breakdown: Guangxi Leads, Yunnan Holds Second Place
Sugar production in China is highly concentrated in the southwestern provinces, where sugarcane dominates.
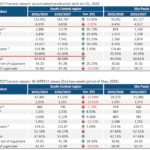
| Region | Output (MMT) | Approx. Share | Primary Crop |
|---|---|---|---|
| Guangxi | 7.697 | ~59.4% | Sugarcane |
| Yunnan | 2.938 | ~22.7% | Sugarcane |
| Xinjiang | 0.796 | ~6.1% | Sugar beet |
| Inner Mongolia | 0.685 | ~5.3% | Sugar beet |
| Guangdong | 0.673 | ~5.2% | Sugarcane |
| Hainan | 0.058 | ~0.4% | Sugarcane |
| Others | 0.118 | ~0.9% | Mixed |
Guangxi remains the undisputed backbone of Chinese sugar production, contributing nearly 60% of national output and serving as the primary driver of this season’s growth. Together, Guangxi and Yunnan account for more than 80% of the country’s total production, underscoring the structural concentration of sugarcane cultivation in the southwest.
Meanwhile, the beet-sugar regions of Xinjiang and Inner Mongolia contributed a combined ~1.48 MMT, reinforcing their role as an important complement to national supply.
What’s Driving the Increase?
Several factors typically underpin a production surge of this magnitude:
- Recovery in planted area – A rebound in sugarcane acreage following earlier declines.
- Improved yields – Favorable growing conditions and better per-hectare productivity.
- Price incentives – Relatively stable sugar prices that support grower sentiment and planting decisions.
Market Implications
The substantial rise in domestic output has meaningful consequences for China’s sugar balance:
- Reduced supply pressure: Greater domestic production helps ease supply constraints and supports price stability in the internal market.
- Lower import dependency: Stronger domestic self-sufficiency may reduce reliance on imported sugar at the margin.
An important caveat: These figures capture domestic production only (including sugar milled from imported cane) and do not include refined sugar derived from imported raw sugar. Analysts assessing total Chinese sugar availability should therefore combine these numbers with raw-sugar import and refining volumes to form a complete supply picture.
Conclusion
The preliminary 12.966 MMT figure for the 2025/26 season represents a significant recovery in China’s sugar production capacity. Supported by the stable foundation of Guangxi and Yunnan, alongside meaningful contributions from northern beet-sugar regions, domestic supply resilience continues to strengthen.
Market participants should continue to monitor actual crushing progress, sugar recovery rates, final end-of-season totals, and the interplay between international sugar prices and China’s import pace.
Data Disclaimer: The data and figures presented in this article are based on preliminary tracking and operational estimates released by ynsugar. Final official totals may vary upon the definitive balance sheet adjustments at the end of the crushing calendar. This analysis is compiled exclusively for informational, educational, and research purposes and does not constitute financial, commercial, or investment advice. Readers should not rely on this content as a substitute for independent market verification.